
Investigating cross-platform visual issuefication: the case of Brazil’s Pantanal wildfires
Project leaders: Carlos d’Andréa and André Mintz – R-EST/UFMG
Team members: Débora Salles, Fabio Gouveia, Federica Laurencio, Jahnnabi Das, Janna Joceli Omena, Leonardo Melgaço and Priscila Yoshihara
Project pitch slides
Final presentation slides
Key Findings
Introduction
Research Questions
Query Design & Visual Protocol
Methodology
Findings
Discussion
References
- While several visual topics composed the visual issuefication of the wildfires, pictures of injured animals and of burning natural landscapes were some of the most frequent and most engaged topics.
- A portion of about 20% of the images posted on Instagram also circulated in other platforms and/or the open web and circulation patterns seemingly relate with platform grammars, use culture and infrastructural relationships. When tracing the circulation of Instagram images across platforms, we identified that images appearing only on Facebook have also been shared by unreliable (dubious) not secure news web pages. Local and regional news media were present in the media ecosystem
- Cross-platform analysis of visual topics occurrence is a promising methodological approach for discussing the visual issuefication of contestated affairs.
Introduction
In 2020, the wetland region of Pantanal, in Brazil, suffered from severe wildfires that destroyed at least 15% of its territory. The worst fires in at least 20 years were caused, according to a Federal Police investigation, by large private farms aiming to expand their pasture lands. Between August and October, thousands of fires were identified daily by INPE, the Brazilian space agency. At the same period, the Amazon forest was also reaching peaks of fires, accentuating a cycle of environmental destruction coordinated since 2019 by the president Jair Bolsonaro and his administration.
Considered the world’s biggest tropical wetland, Pantanal has an area of 250,000 km² – larger than the United Kingdom – distributed between Brazil, Bolivia and Paraguay. One of the singularities of its ecosystem is the intense presence of a unique fauna, including hundreds of bird species and “the largest known populations of several threatened mammals” (Harris et al., 2005). Some of its conservation areas were highly impacted by wildfires – 64,8% of the Encontro das Águas State Park (where jaguars are concentrated) had been destroyed until mid September.
The devastation of Pantanal had intense international repercussions. For instance, photos and videos of animals injured or being rescued by volunteers (Kaz, 2020) circulated intensively on social media and were highlighted in the journalism coverage. An overview of the key events of the most critical period of fires (August to October 2020) can be visualized in a board elaborated by the project coordinators and by Maíra Ramos in preparation for the sprint (click in the image below to navigate through the interactive timeline)
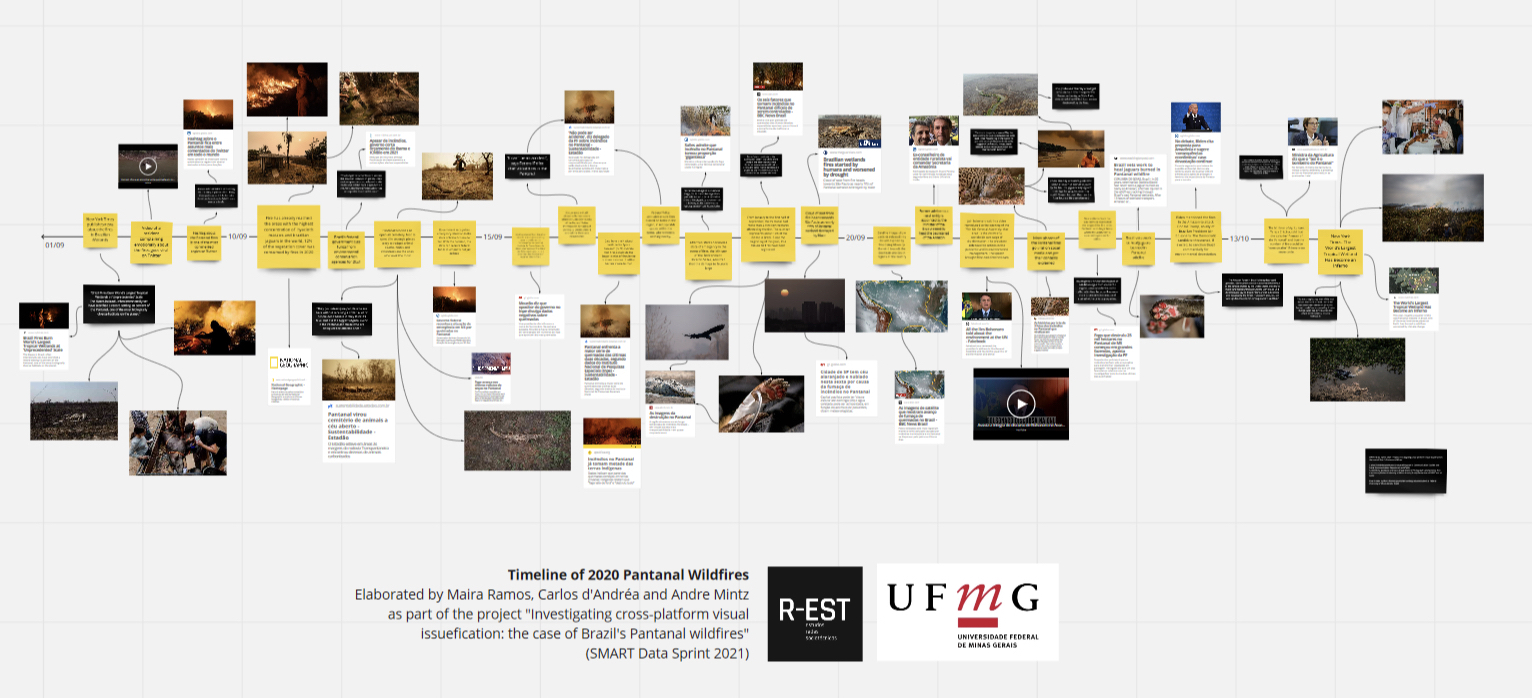
Figure 1 – Overview of an interactive timeline of 2020 Pantanal Wildfires
The neglect of the Brazilian government was a topic of intense public debate. The denialism of the president, his Minister of the Environment, Ricardo Salles, and other high ranking politicians included questioning the reliability of satellite data provided by state agencies. On September 21, during the opening session of the General Assembly of the United Nations, Jair Bolsonaro said that his administration was being victim of a “brutal campaign of lies” about the Amazon and Pantanal.
In this study, we explore how the socio-environmental catastrophe of the 2020 Pantanal Wildfires may be understood through the intense circulation of different types of images that negotiate a public visibility and framing of the event. Based on a material and situated perspective, project coordinators have proposed a visual issuefication approach to study the formation of image-related discussions on the topic.
Thus, the study articulates “the detection, analysis and visualization of public contestation over topical affairs” – as Marres and Gerlitz (2016) define issue mapping – with a methodological perspective that emphasizes the ‘visual-turn’ of social media platforms (Faulkner et al., 2018; Gibbs et al., 2015). In other words, the proposed frame of visual issuefication leads our approach to these images as active mediators in the translation of such complex events into matters of concern (Latour, 2004) in online discourse.
To study how the catastrophic events of the 2020 Pantanal wildfires were depicted through different types of static images, our starting point is Instagram and the “visual social media cultures” enacted through this social media platform (Leaver et al., 2020). Our mixed methods design combines the individual and aggregate analysis of images building upon previous experiments by the authors and other researchers. Through reflexive and critical application of machine-learning-based models, we aim to produce composite visualizations to aid the identification of emergent visual topics and depictions found in the images.
Also, the project aims to further advance methods for studying cross-platform image circulation (d’Andrea & Mintz, 2019), through which we have sought to investigate a broader range of platforms and websites in which some of the images found on Instagram were also published, pointing to the emerging relationships between different online ecosystems which are usually overlooked by platform-centric approaches.
RQ1: How were the 2020 Pantanal wildfires visually issuefied on Instagram?
RQ2: How does the visual issuefication on Instagram relate with a broader ecosystem of other social media and sites/platforms?
RQ3: Can emerging relationships between visual topics, engagement metrics and cross-platform circulation inform elements about the visual issuefication of the studied events?
Query Design & Visual Protocol
Our initial dataset consisted of a total of 11,540 Instagram posts ranging from the 15th of August until the 15th of October of 2020, comprising roughly 21,822 image files – each post can contain, in an album, up to 10 images.
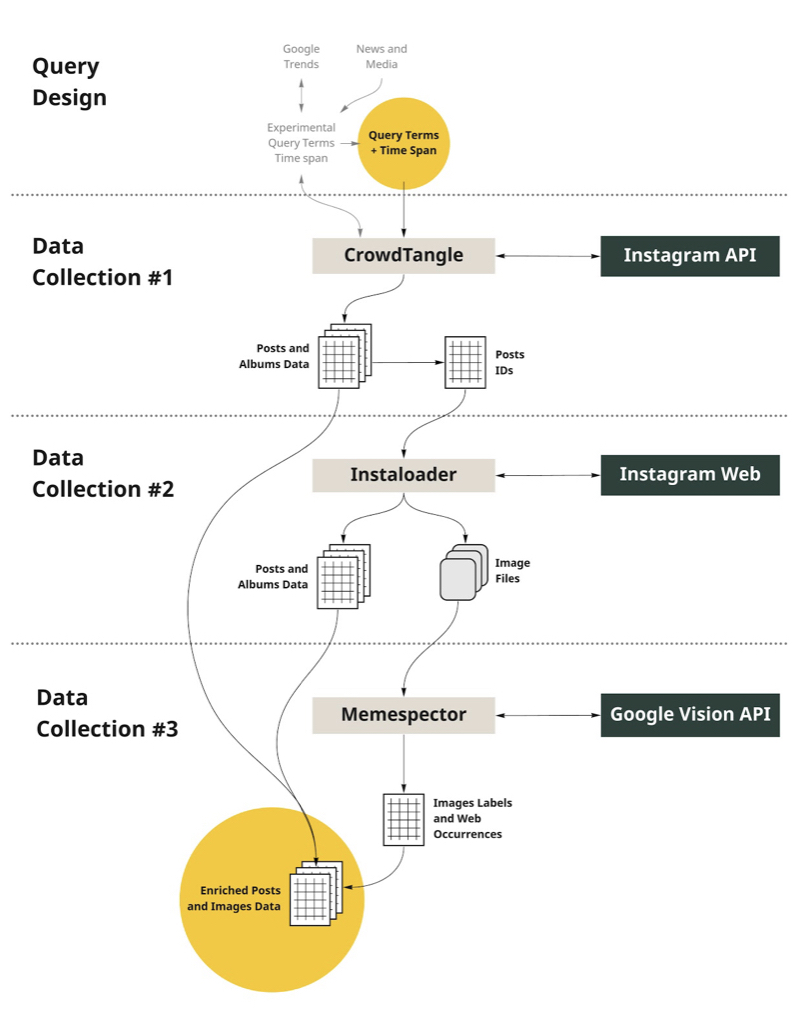
Figure 2 – visual representation of the method protocol
The data set was built through CrowdTangle (CT), Facebook’s own “insights tool” for data analysis. The query was for the term [pantanal] and posts were filtered for the types photo (containing a single static image) and album (containing a set of static and/or moving images) (Figure 2, Query Design). In the latter case, only static images were downloaded. Posts of the type video and IGTV, as well as stories were not included in the data collection (Figure 1, Data collection#1)
Data obtained through CT has also been enriched using Instaloader (Graf et al., 2019), a scraping-based python package. Its use was mainly due to CT having provided expired URLs for the posts’ images. Thus using the individual shortcodes obtained for each post through CT, posts images and accompanying data were downloaded using Instaloader. Therefore, this has allowed us to not only fill in gaps left by CT, but also to expand the metadata available for each post, including the accessibility captions for the images – which are not provided by CT. (Data Collection #2)
Initially, it was intended to process the obtained images through a perceptual-hash algorithm (Image-Match) to identify unique images among the image files obtained from scraped posts. However, during the data sprint we identified inaccurate results from this processing, apparently from particular visual attributes of these images. As this algorithm works by grayscale pixel sampling, images of smoke covered landscapes were frequently misidentified as the same (Figure 2). For this reason, this initially intended process was excluded from the method design.
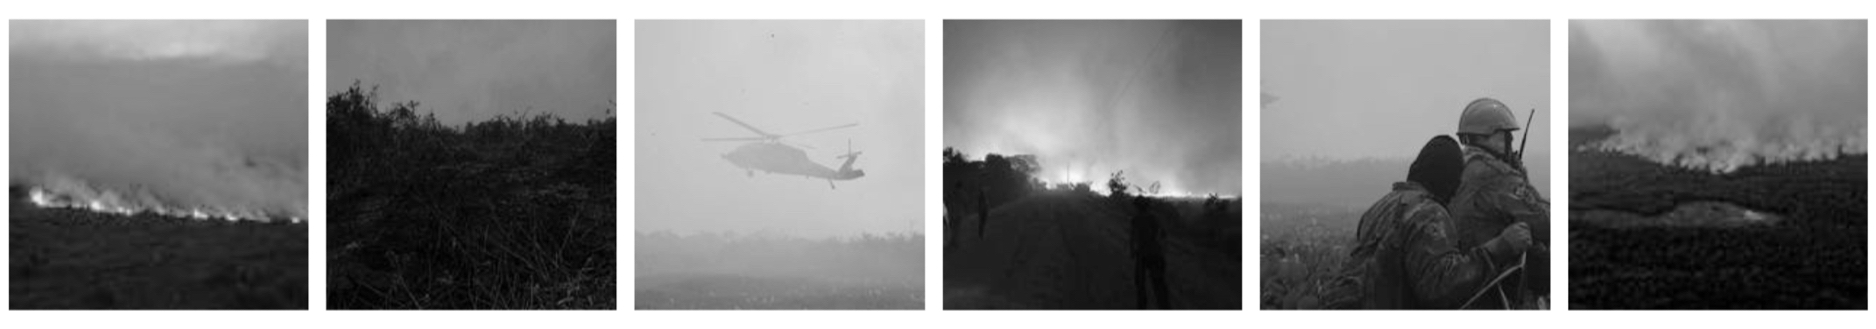
Figure 3 – sample of images misidentified as the same image in the dataset
Each of the 21,822 images obtained from the Instagram posts were processed through Google Cloud Vision API (Data Collection #3). This is a commercial computer vision product, which provides different modules for processing image files. It was chosen due to previous experiments conducted with the API’s label detection module (Mintz, 2019; Mintz et al., 2019; Tarcizio Silva et al., 2020) and, particularly, due to its unique web detection module, which allows to perform reverse-searches of the images on the web. The application of the web detection module replicated elements of a methodology previously developed by the project coordinators (d’Andrea & Mintz, 2019). Processing was done through the Memespector script (Mintz, 2018b; Rieder et al., 2018).
During the data sprint, analysis was divided into two efforts. While a subgroup focused on Instagram data and computer vision models to understand the visual issuefication on this platform, a second subgroup relied on the content-based web search of Google Vision API’s web detection module to track the cross-platform circulation of the images and the resignification of the visual issues.
Visual issuefication on Instagram
Google Vision API returns a list of labels for each of the images processed, together with a score indicating the probability of that label being relevant to that image. Analysis within this effort focused on this data in combination with metadata related to the Instagram posts. Different approaches were developed.
One approach focused on the clustering of the images based on the labels attributed to each of them. Following an approach that has been pursued in several previous studies (Mintz, 2019; Mintz et al., 2019; Omena et al., 2020; Ricci et al., 2017; Rykov et al., 2016), this analysis was based on the construction of a bipartite graph in which images and labels were the nodes and relationships between them were the edges. Thus, the 21,822 images were connected with 2,588 labels provided by Google Vision API.
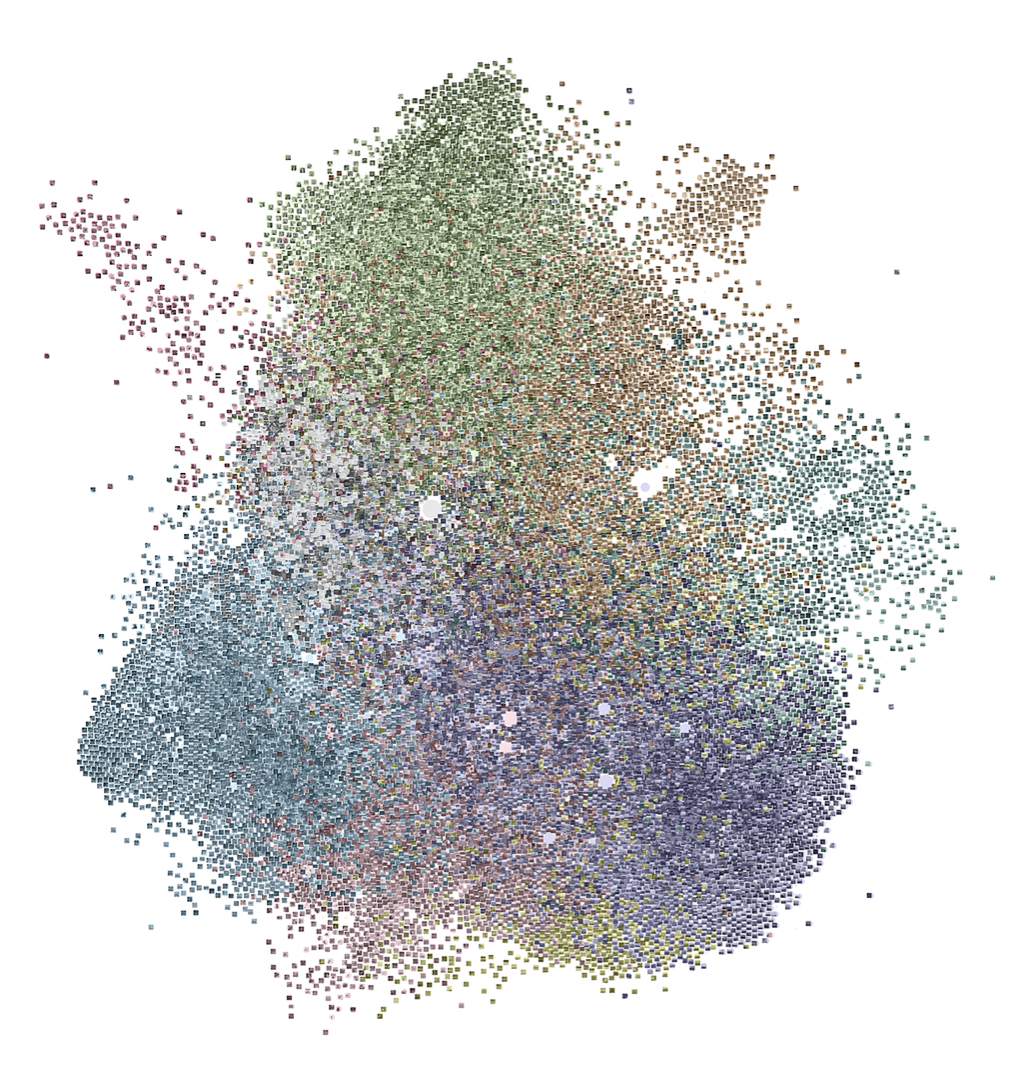
Figure 4 – Bipartite image-label graph.
Figure 4 shows the bipartite graph spatialized with ForceAtlas2 algorithm (Jacomy et al., 2014) in Gephi (Gephi Consortium, 2017). Colors were applied based on the modularity classes identified through the community detection algorithm (Blondel et al., 2008) provided in Gephi. In the figure, the visualization of the graph with colored clusters is overlapped to its image-plotted version, which shows the actual images filling the positions of their corresponding nodes in the spatialized graph. This plotting was done with Image Network Plotter script (Mintz, 2018a).
Based on this graph, we conducted a qualitative analysis of the identified modularity classes in order to semantically describe the visual content of the images grouped in each cluster. The identified topics were: animals, food, graphic elements, group photos, landscapes, portraits, and rescue vehicles. Figures 5 and 6 show samples of two of these visual topics. Figure 7 shows a dendrogram describing the hierarchical relationships between topics, subtopics and modularity classes.
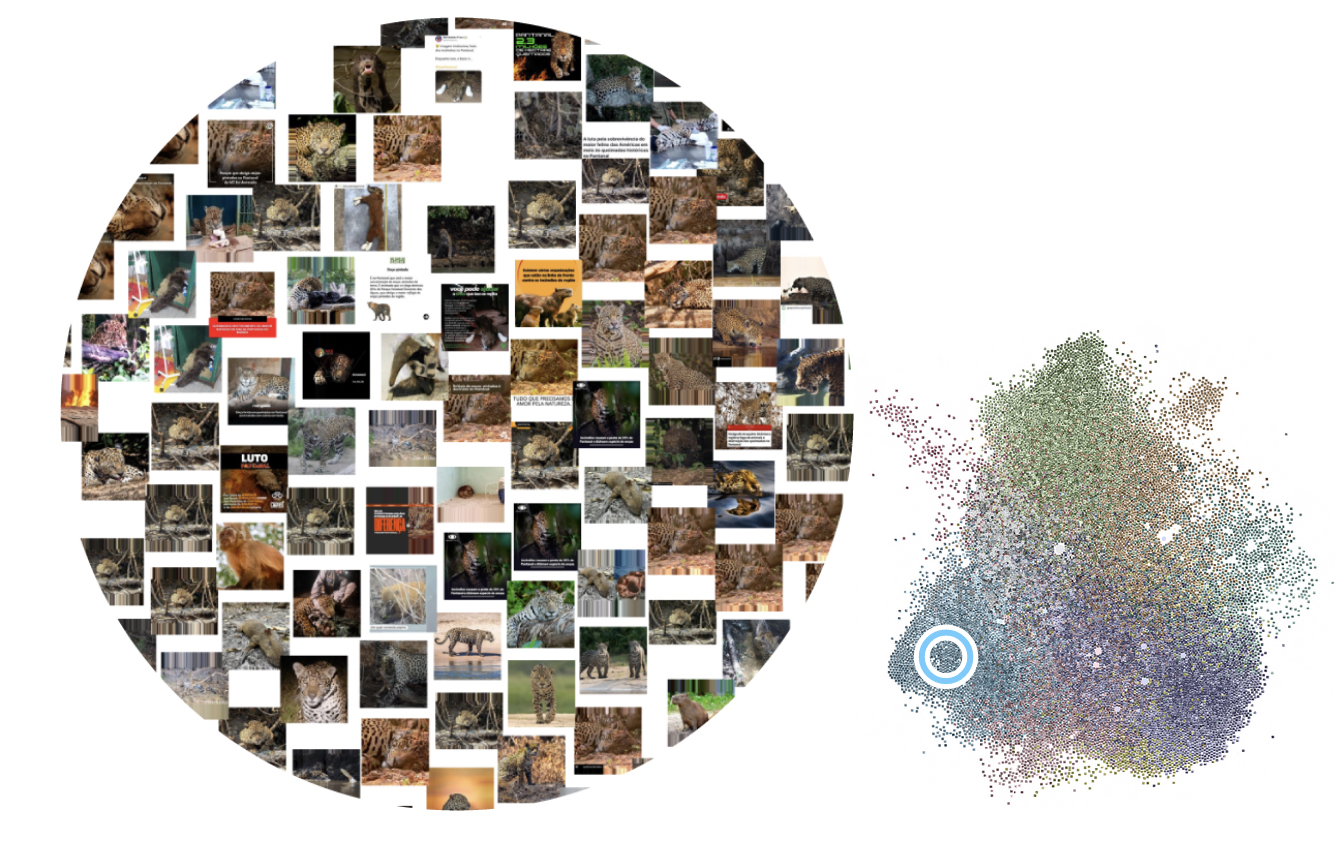
Figure 5 – Sample of the animals’ visual topic.
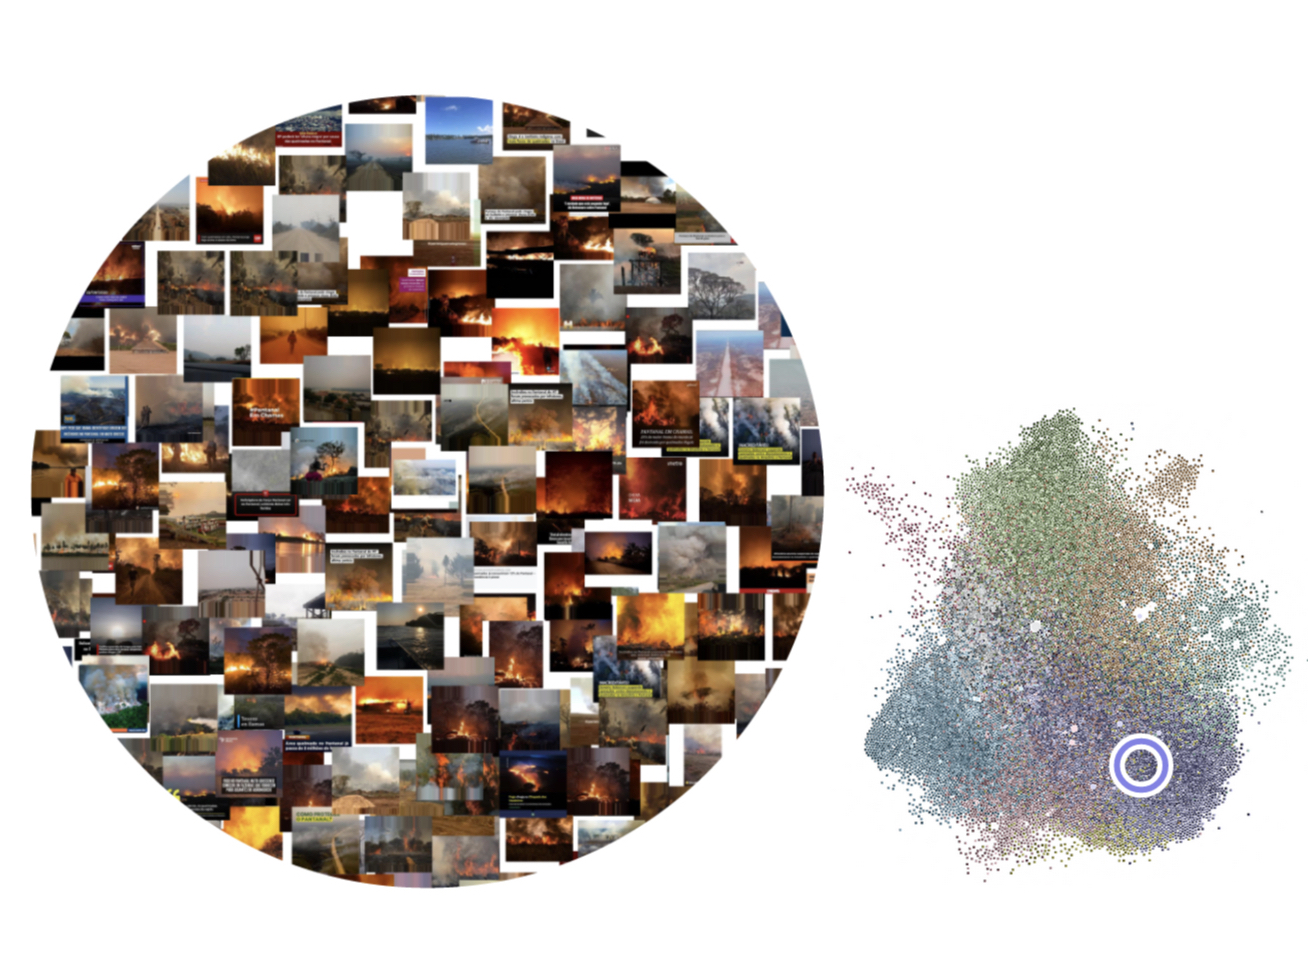
Figure 6 – Sample of the landscapes’ visual topic.
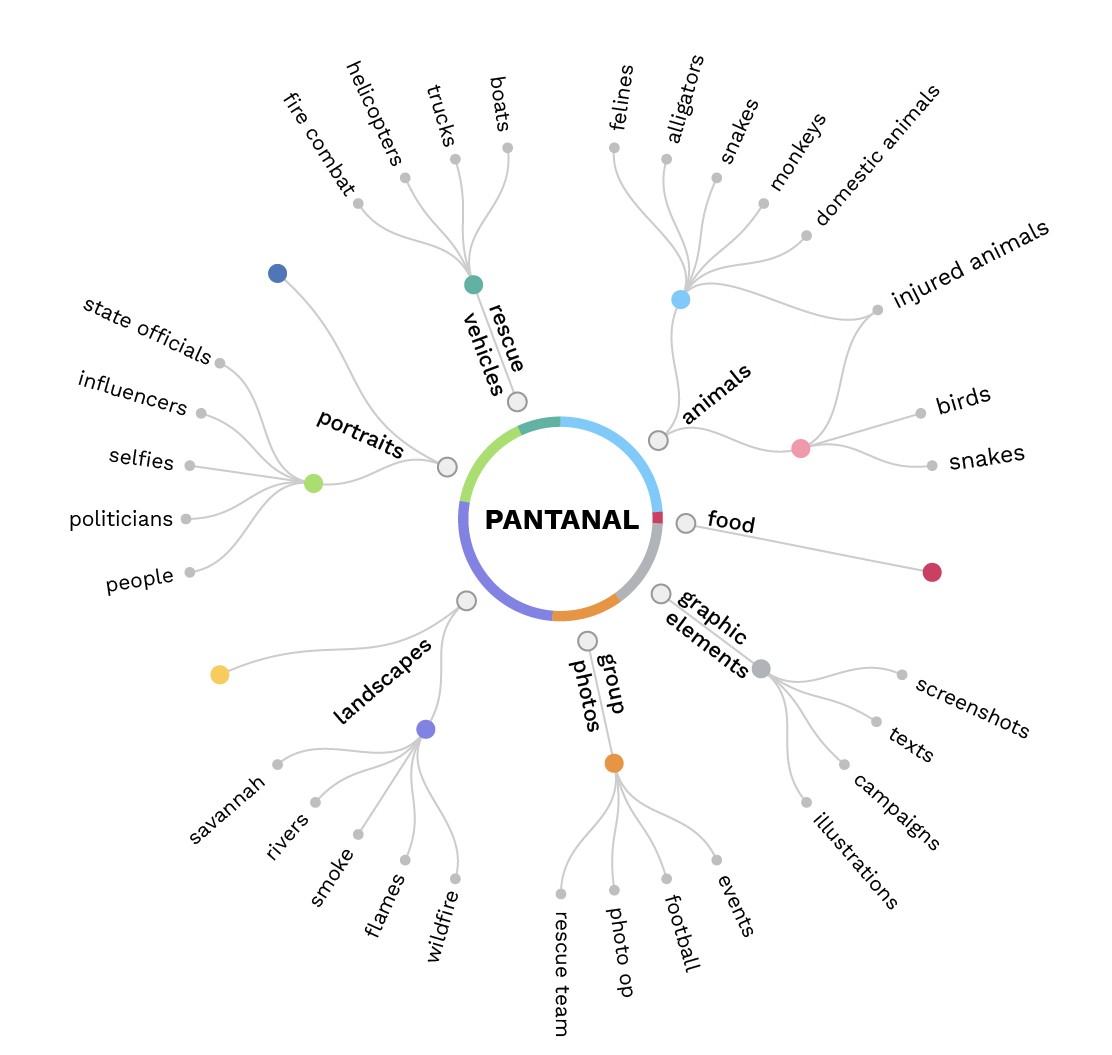
Figure 7 – Visual topics dendrogram.
This process led to a categorization of the images through a mixed method approach. Labels attributed by Google Vision API led to the clustering of images taken as similar in that categorization. This clustering then led to manual coding of the clusters, based on distant reading of the images grouped in each of them. This coding allowed us to describe visual topics contributing to the issuefication of the investigated event.
These topics were fed back to the dataset, which allowed us to cross the visual categories with other metadata obtained from Instagram. While it would be possible to pursue various analytical strategies, we only managed to pursue two of them: describing the evolution of the topics over time and understanding their relationship with engagement metrics – according to the platform’s grammar and commercial strategies. On this stage, actual answers to the research questions could be drafted. The analysis of these aspects are presented in the Findings section.
Cross-platform circulation of Instagram images
A second analytical effort was to understand the cross-platform circulation of the 21,822 images beyond Instagram. Using Google Vision API web detection module, we were able to retrieve URLs for the pages in which images that fully matched the Instagram images were found. In order to allow for further aggregation of the obtained URLs, we segmented those URLs according to its standard components (sub-domain, domain, path), and grouped the URLs based on their domain component. This approach is based on previous research from the project coordinators (d’Andrea & Mintz, 2019), which has also dealt with limitations of the method, further indicated in the Discussion section.
In this way, we were able to find external occurrences of 4,678 images – from the 21,822 that were scraped from Instagram. In total, those images were found in 7,566 different domains. In order to analyze these occurrences, we constructed a bipartite graph, in which images and domains were represented as different types of nodes, and the occurrence of an image in a domain was represented as an edge. Figure 6 shows the visualization of this graph.
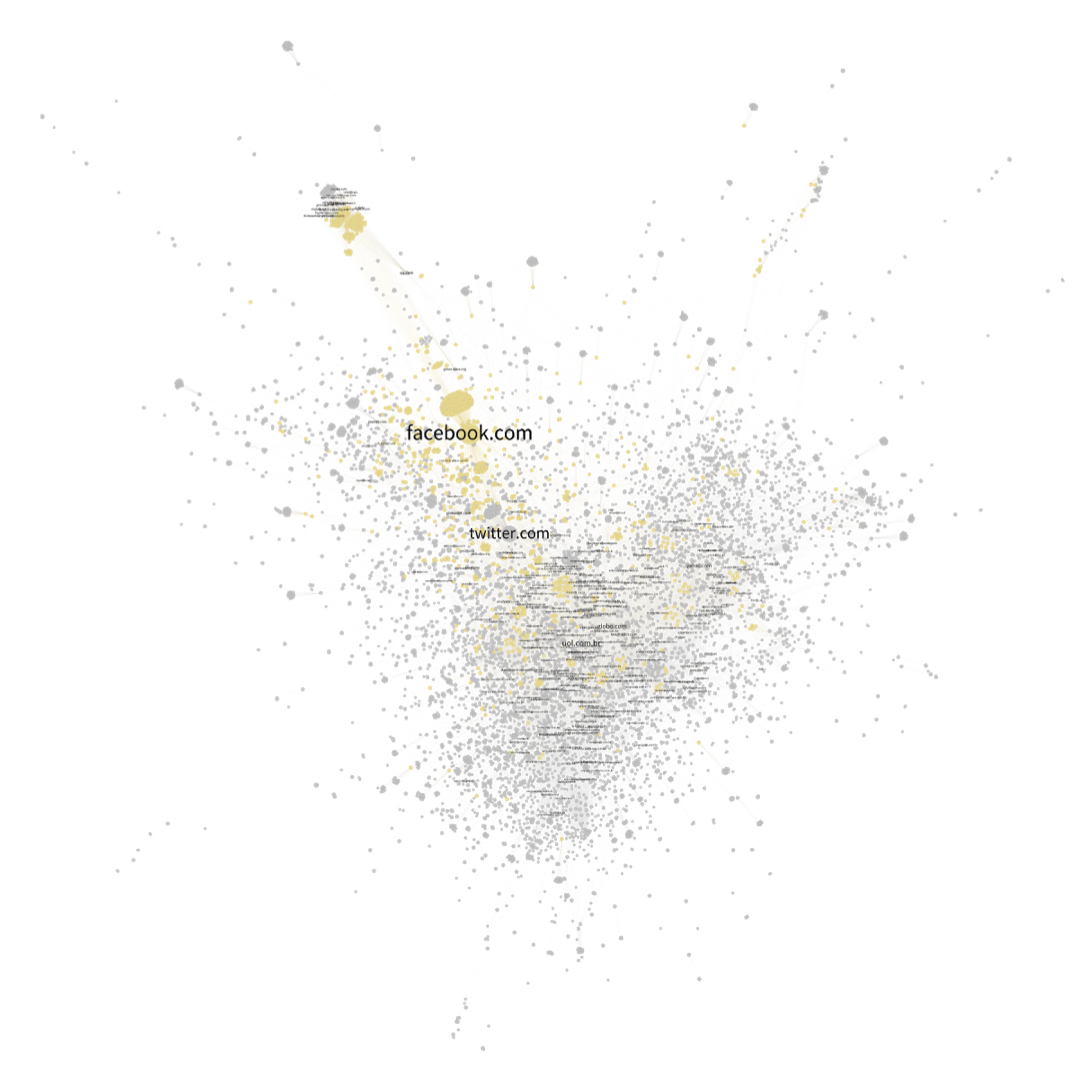
Figure 8 – Bipartite image-domain graph.
To build a network of image circulation, we relied on the outputs of Google Vision API with a basis on its web page detection feature. We explored and analysed the network with a visual network analysis approach (Venturini et al., 2019) taking into account platform grammatization and software affordances (Omena & Amaral, 2019; Omena & Granado, 2020).
- To extract the top domain level with Domain Extractor (Chao, 2021).
- Create a bipartite graph using Table2Net (by Mathieu Jacomy)
- Give a shape to the network in Gephi (Version 0.9.2, 2017) using ForceAtlas2 (Jacomy et al., 2014)
- Plot the images using Gephi plugin Image Preview.
The navigational procedure was facilitated by Gephi overview and data laboratory, Miro (a collaborative whiteboard platform), Instagram and other Web environments (see the video below). To read the network, we considered its unwritten principles (node position, size and colour) and hermeneutic values (Venturini et al., 2019), also taking into account the narrative affordances of the graph layout algorithm ForceAtlas2. Therefore, we conducted the analyses of images and sites of occurrence according to fixed zones for interpretation (centre, mid-zone and periphery), yet allowing specific forms of reading (see Omena & Amaral, 2019).
The relative position of the clusters and of individual domain nodes provided insights into the sharing of images between particular social media platforms and particular types of websites from the open web. Presumably, domains placed close to each other share a significant amount of images that occur on both of them. The analysis of these relationships allowed us to infer some general elements of the cross-platform circulation of images, pointing to some answers to our research questions. Besides this aggregate analysis, in-depth analysis for data of specific images was also productive for understanding the dynamics of such circulation. All of this is further analyzed in the Findings section.
The methodological steps described in the previous section allowed the drafting of initial answers to the research questions outlined from the start. In this section, we present the outcomes of the analysis produced from those procedures and answers drafted to the research questions.
Visual issuefication on Instagram
Regarding the visual issuefication of the wildfires on Instagram (RQ1), we found several visual topics among the images in our dataset, which point to different types of visual representation of the events. In a sense, those visual topics could indicate an answer to how the event was issuefied. However, they should be taken together with other aspects in order to complexify the answer and to actually discuss the matter of visual issuefication and not solely the visual representation of the wildfires.
Issuefication, in this sense, involves the public contestation that surrounds the affairs, once turned into matters of concern. Considerations on the mapping of visual topics should therefore consider elements beyond the simple identification of images clusters. Thus, in part, RQ1 possibly needs to be considered together with the platform metrics and grammars evoked on RQ3. While several approaches could be developed, including following a closer reading of particular images and posts, the combination of the visual topics with posts metadata shows initial findings regarding this question.
First, concerning the occurrence of the different topics over time, as shown in Figure 9. The dynamics of the visual topics occurrence allows distinctions to be made among those topics. The period spanning between the 6th and 26th of September is clearly central to the issuefication of the wildfires. Those dates are visible in the graph, but there are also key dates in the period in which the wildfires gained public visibility:
- On the 15th, the Brazilian institute for space research (INPE) informed that the sequence of WildFires in Pantanal was the highest in two decades.
- On the 18th, black smoke produced by the fire reaches São Paulo and other densely populated cities in Brazil.
- On the 21st, president Jair Bolsonaro contested the wildfires in his speech at the United Nations’ General Assembly.
Therefore, the increased number of Instagram posts in this period are related to the increased visibility and debate surrounding the fires. The temporal dynamic of particular visual topics indicates how visual issuefication of the fires on Instagram oscillates according to specific events.
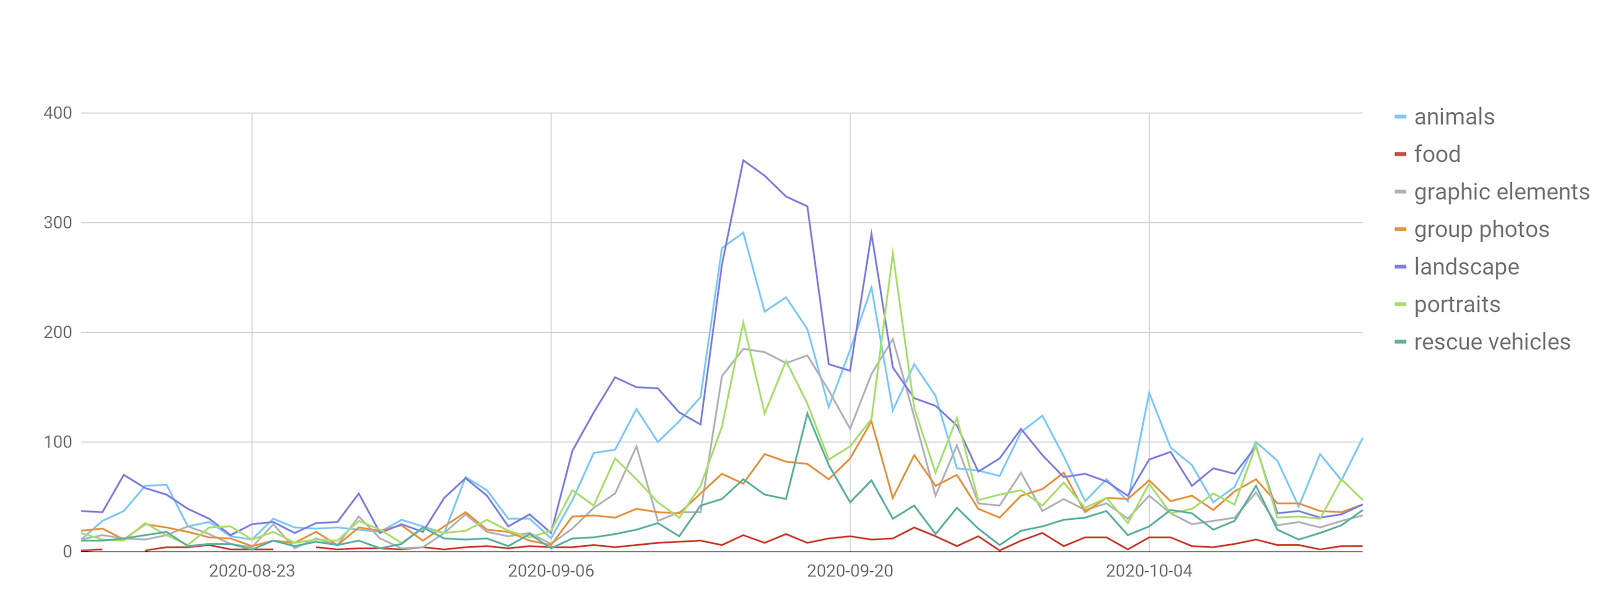
Figure 9 – Line chart indicating the number of posts relating to each topic over time.
As the chart shows, the food category is not only minor in the dataset, but it also does not increase significantly in the period of increased debate and visibility. Topics that occur the most in mid-September are: landscape, animals, portraits, and graphic elements. Landscape is consistently prevalent throughout the period, followed by animals. Importantly, the portraits topic peaks on the 22nd of September, the day after Bolsonaro’s speech at the UN.
Considering that the graphic elements topic is mostly related to screenshots, texts and campaigns – visual renderings of verbal content – we could indicate that, as initially hypothesized, landscape and animals were fundamental topics in the visual issuefication of the wildfires on Instagram.
An additional analysis of the topics considered metrics for the platform-enabled engagement received by posts containing such images. Figure 10 shows this data aggregated as the median value of likes received in posts according to the visual topics. It shows that, even though the landscape topic occurred more frequently, posts of the animals’ visual topic received much more likes than any other topic. Therefore, data indicates that images of animals prompted more reactions from their audience, which could be cautiously read as an indicator of public sensitivity to this visual topic within the wildfires issuefication on Instagram.
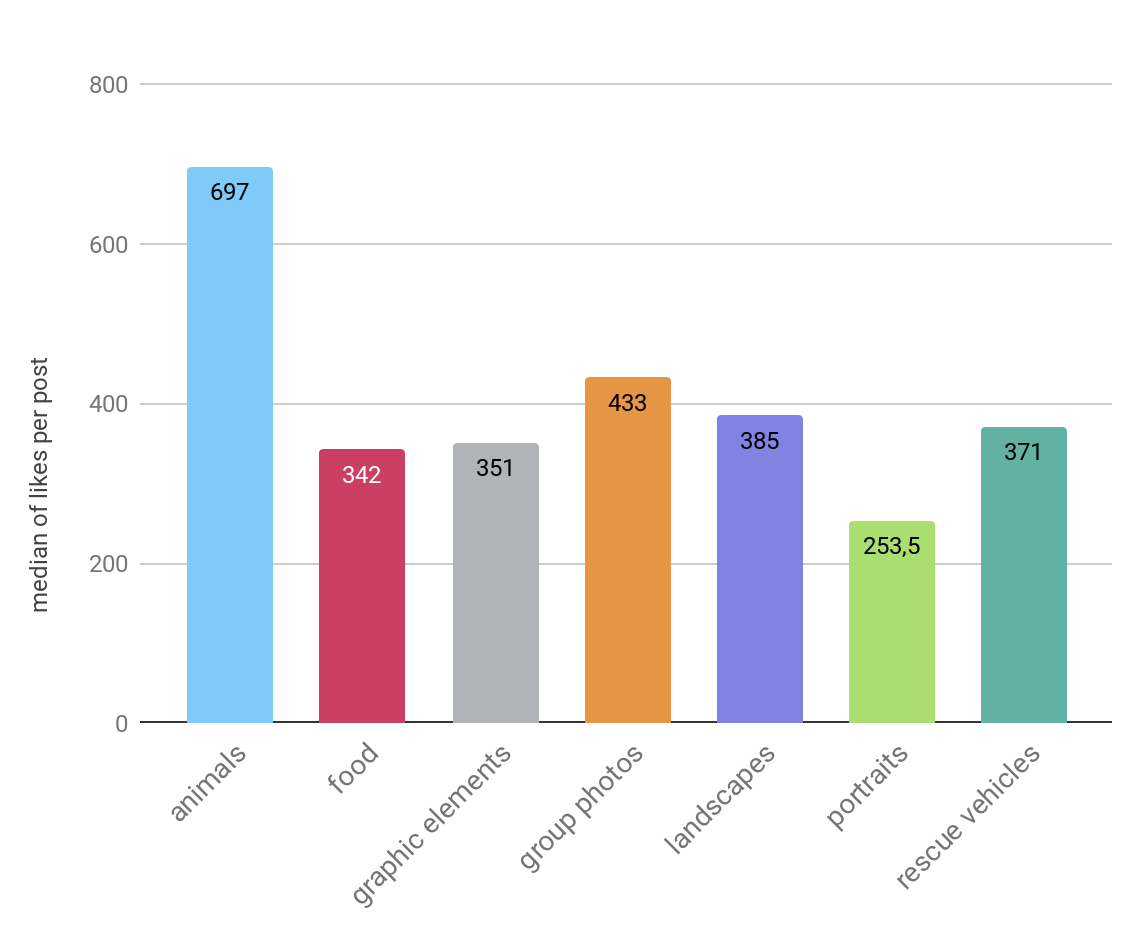
Figure 10 – Bar chart indicating the median of likes received by each image according to its visual topic.
Exploring and analysing the network of Pantanal wildfires image circulation
Regarding the relationship between the visual issuefication on Instagram and the cross-platform circulation of the images, the procedures described in the previous section (“Methodology”) enabled other forms of analysis and expanded the findings just outlined. Leading the analysis was the image-domain network, constructed with Instagram images and through data obtained from Google Vision API’s web detection module.
The image-domain network was built on top of Google Vision features (Web page detection) and it is constituted by 7,566 top-level domains and 4,678 images (nodes) (Figure 11). Here connections are made according to the occurrence(s) of one or more images in web pages. The network shows which images collected on Instagram also circulated on social media platforms (such as Facebook, Twitter, Pinterest), news media ecosystem and unreliable web pages. The top-level domains were detected by Google Vision API, indicating the sites of image appearance. Crucial here is to understand that image circulation relates to the number of web pages in which full matching Instagram images (related to Pantanal wildfires) appear, rather than a movement with an order or images moving to and fro.

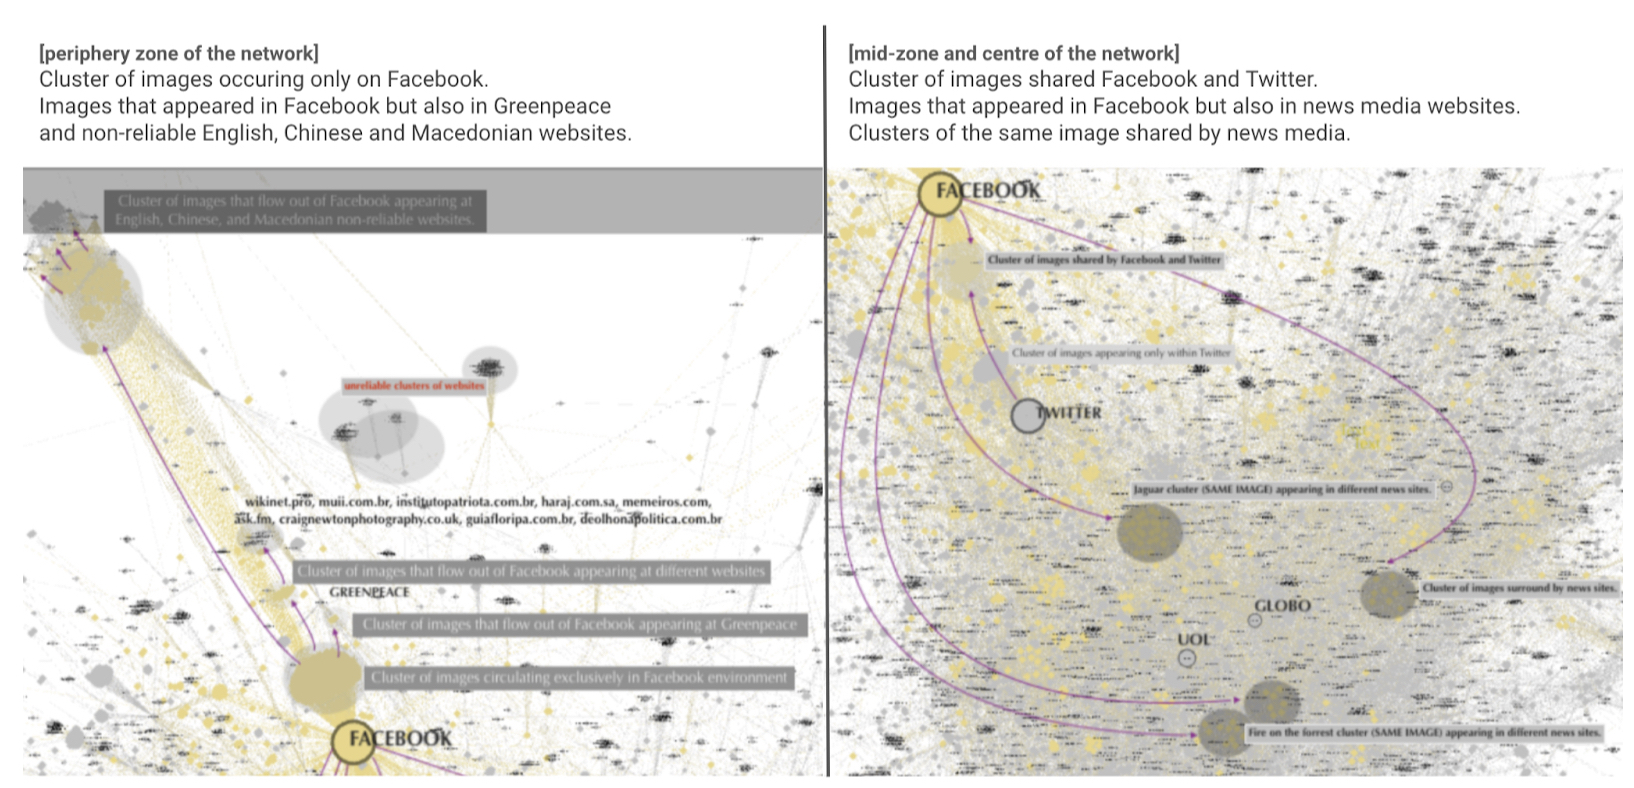
Figure 11. Computer vision network of 2020 Pantanal wildfires: analyses of images and sites of occurrence. 12.244 nodes: 7.566 top-level domains and 4.678 images. Above an overview of the whole network, while the images below zooming in on the periphery zone (left) and mid and central zones (right) of the network.
Of a total of 4,678 Instagram images related to the Pantanal Fires in Brazil, 1,849 have appeared on Facebook (see its node size in the network in Figure 11), followed by Twitter (1,238), UOL (537) and Globo (518) (two of the largest internet portal in Brazil) . Considering node size (total number of images appearing on a top-level domain), we decided to trace the path of images that occurred on Facebook and also on other webpages, highlighting in yellow the platform neighbours within the network (see Figure 11, the clusters of images in yellow).
The visual network analysis starts with the periphery zone of the network in which Facebook holds a cluster of images (a total of 1,849) appearing only within the platform (see Figure 11, left). The limited time did not allow us to look closely at these images. By continuing to follow the images in the peripheral area, we see image clusters shared on Facebook and elsewhere. For instance, the image of a deer was published by Paranagua News Instagram account (@paranaguanoticias), considered by Google Chrome as a not secure connection to the web page. This means “the site isn’t using a private connection. Someone might be able to see or change the information you send or get through this site”, meaning the user should navigate the webpage with caution. As we move away from the Facebook node, we see an isolated cluster of images shared on unreliable and not secure news web pages (see a list below) – mostly in English but also in Chinese and Macedonian. These pages are most likely click baits or related to misinformation(see the list of pages below, some of these were also flagged by Google Chrome as not secure pages, look at the screenshots below).
Unreliable/dubious news web pages:
https://www.brighthumanity.me/
https://greenlemon.me/
https://www.storepaperoomates.com/
https://guncelkal.net/
https://www.demilked.com/
https://pkhype.com/
https://aworkstation.com/
https://www.boredpanda.com/
https://min.news/
https://www.navalica.com/
Not secure news web pages:
http://ww1.imgkao.com/
http://www.successlifelounge.com/

One of the images, shared by the above dubious news web pages, was originally published by the journalist and illustrator Ademar Vieira; a comic strip called “Mother” re-posted by Greenpeace Brasil, alternative news media such as Quebrando o Tabu and Mídia Ninja, and Instagram ordinary users. While exposing the cross-platform image circulation of the forest fires in Pantanal and Amazon, this example reveals the complexity of this kind of process. Precisely indicating specific visualities that feed misinformation or click baits news sites but also appear on Facebook (see Figure 13, right side above). In other words, images coming from Instagram (according to our initial dataset) were detected by Google Vision API as a full matching appearance on Facebook and misinformation news sites.
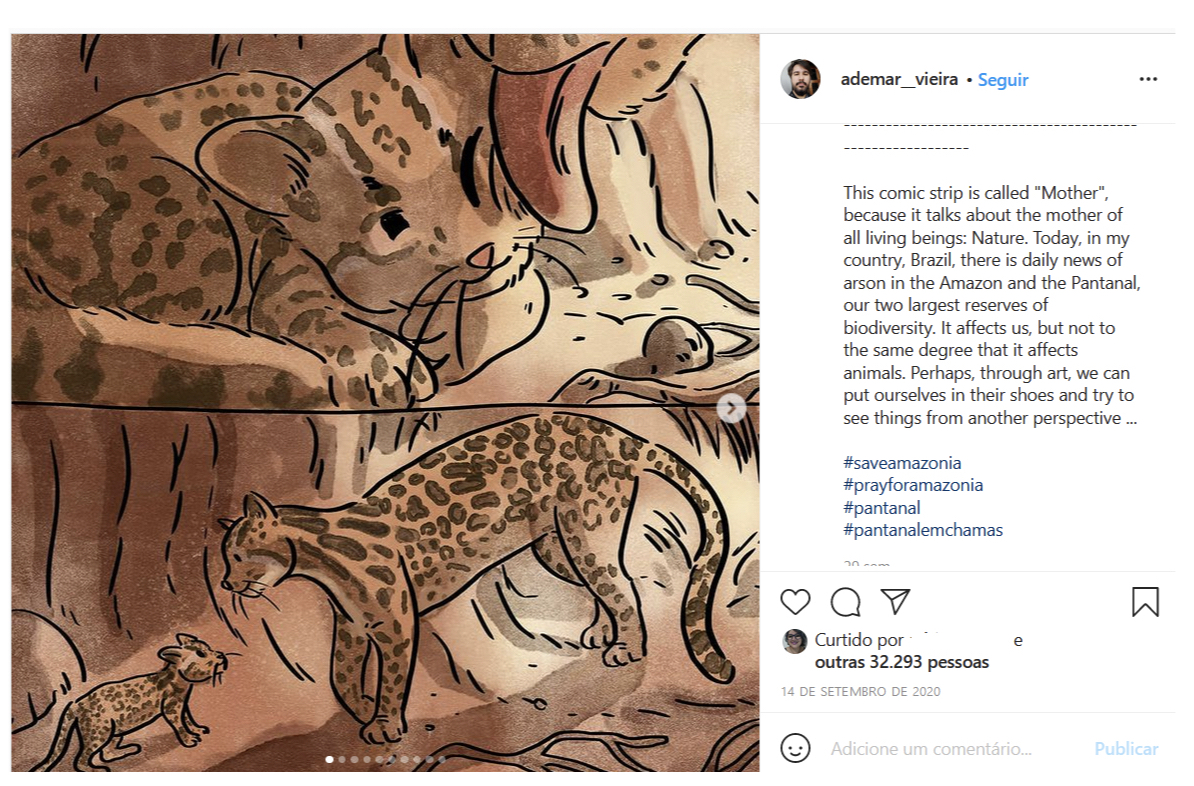
Figure 12 – Screenshot of the Instagram post with a comic strip published by Ademar Vieira
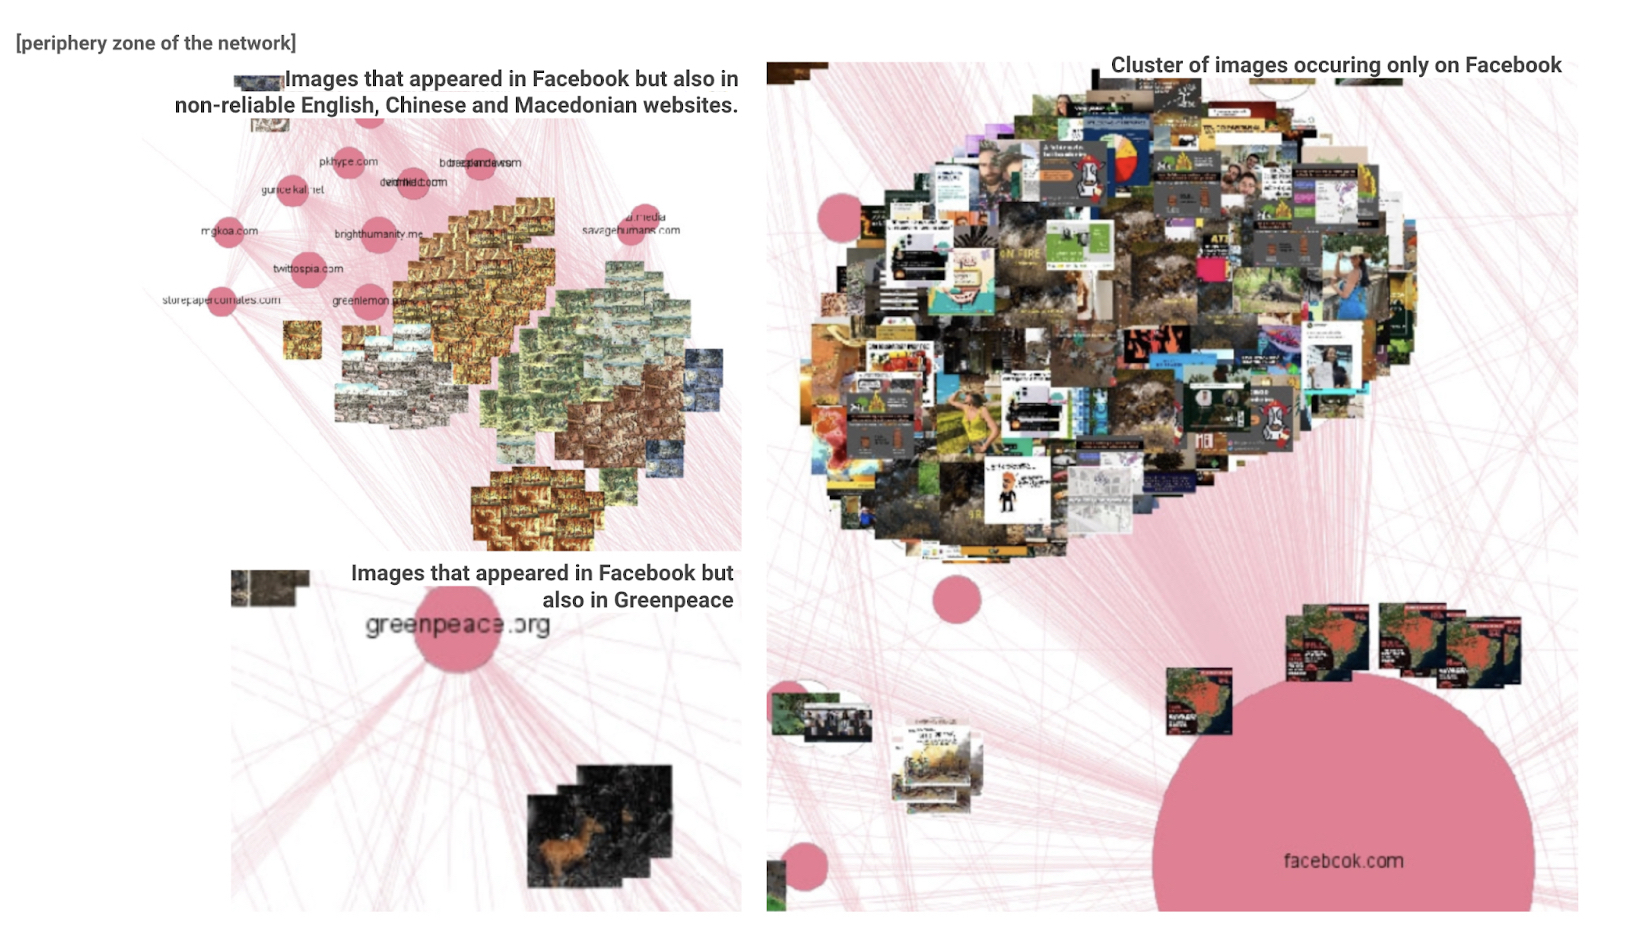
Figure 13. Computer vision network of 2020 Pantanal wildfires: the periphery zone of the network. On the left, the image of a dear that appeared on Facebook and also on Greenpeace and non-reliable websites. On the right, images occurring only on Facebook.
Now moving towards the centre of the network, we see the news media ecosystem (Figure 14, see also Figure 11 left side). Mainly local and regional Brazilian news media websites and, in a minor amount, international news media. Facebook has again a central role, most of the images that occur on the news media ecosystem also appear on the platform. This was inferred due to the visual affordances of the network itself, see the presence of the yellow nodes; they are all connected to Facebook. Images were also frequently found on Twitter which acts as a bridging node, sharing specific visualities with Facebook that require further analysis. In this case, it is important to observe that Twitter’s platform architecture favors the retrievability of posts and image objects by search engines. Therefore, in the terms proposed by d’Andrea and Mintz (2019), it presents a broader retrievability horizon in this method. However, it is also relevant that Twitter shares a significant number of images both with Facebook and with several other domains composing an ecosystem of news media websites.
Figure 14 also highlights a cluster of photos of an injured jaguar, which provided further findings regarding the cross-platform dynamics of the wildfires. The picture in case refers to an injured jaguar named “Donal” taken by tourist guide Ailton Lara during a rescue effort by voluntary work in Encontro das Águas State Park . The image was published on his Instagram profile on September 10th (Figure 15) and went viral on social media and news websites (Lemos, 2020). Moreover, we could identify that the jaguar image has also circulated across local and regional news websites from Pantanal in Brazil, among which opantaneiro.com.br, afolhadomeionorte.com.br, noticiascg.com.br and jnmt.com.br. These pages are related with cities and regions in Brazil that are located close to the place in which the fires took place.
Figure 14. Computer vision network of 2020 Pantanal wildfires: the central zone of the network. Section of the image-domain graph containing instances of the injured jaguar photo.
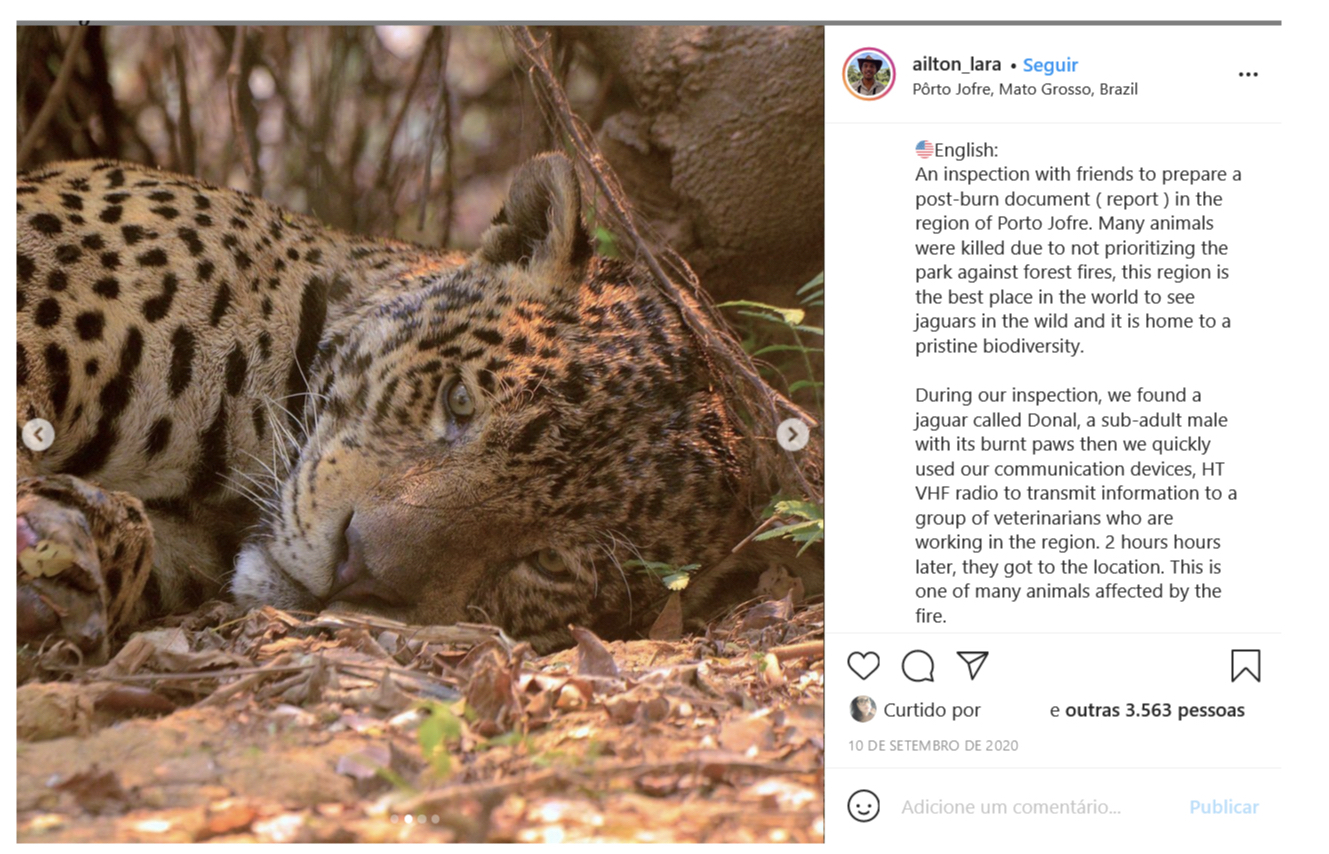
Figure 15 – Screenshot of the Instagram post with one of the photos published by Ailton Lara
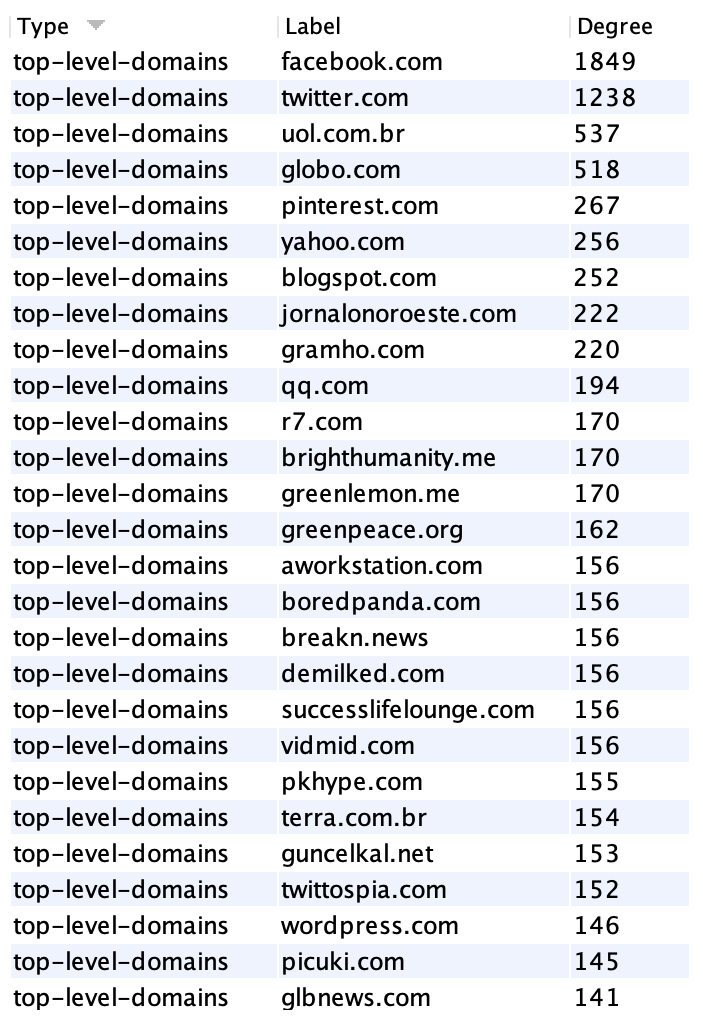
Figure 16. Top-level domains and a respective number of Pantanal fires-related images that appear in these web pages according to Google Vision’s web detection.
In sum, the research sprint indicated the following findings for each of the initial RQs:
RQ1: Many different visual topics could be found in relation to the Pantanal wildfires on Twitter. Prevalent depictions of the event were found in photos of burning landscapes and of injured animals. Those topics were the most occurring during the period of increased visibility and debate about the fires, seemingly as a reflex of events with wide repercussion in news media. Pictures of animals received significantly more likes than other topics on Instagram.
RQ2: Instagram images were found to be partially connected to other platforms and the open web. About 20% of the images on the dataset could be found in other platforms using Google’s reverse search engine. Facebook was the platform sharing the largest amount of images with the Instagram-based dataset, suggesting the relevance of factors such as shared affordances and infrastructure. Twitter also shared a significant number of images and, importantly, was the platform most connected with a news media ecosystem.
RQ3: Experiments performed in this investigation suggested that multiple perspectives should be approached for understanding issuefication. While engagement metrics provide a platform-centric approach highly embedded in platform grammars, they seem relevant for indicating audience sensitivity for particular visual topics in the process of issuefication. Analysis of cross-platform circulation seems to be relevant for decentering the approached platform and understanding its situatedness in the online ecosystem. Finally, in-depth analysis of the circulation of particular images seems to enrich the analytical perspective by showing situated processes occurring within the more general aggregated analysis.
The findings inform aspects of how the Pantanal wildfires were issuefied on Instagram and on social media platforms, more broadly. The initial indications about the particular relevance of images depicting injured animals corroborate previous studies that have pointed to the role of such images in environmental issues such as global warming (Born, 2018). Data analyzed in the investigation suggest animals are relevant in creating some form of empathy and engagement on the part of the audience. In an interview for BBC Brasil, the author of the injured jaguar photo shared this expectation: “I hope this photo of the jaguar serves to mobilize people to preserve the environment and to be concerned with nature, which is common good” (Lemos, 2020).
Meanwhile, the prominence of landscapes, while they may be related to the characteristics of the wildfires event and the means to document it, other aspects are suggested in the comparison with other visual topics. The images of burning vegetation seems to have dominated the visuality of the event, and not so much rescue efforts, for instance. While further analysis would be necessary to assert more precise considerations on these indications, they already point to promising lines of inquiry and take-aways related to the issuefication of similar events.
Regarding the outputs of Google Vision API, it was expected to see social media (Facebook and Twitter) and Brazilian mainstream news media (UOL and Globo) as the sites in which the majority of the images have appeared, particularly taking into account how GV may rely on and respond to the Web hierarchical structure (where social media platforms belong to the top layer). However, such results should not redirect one’s attention or critical thinking when seeking to understand the Pantanal wildfires visual issuefication. Quite the opposite, by accounting for the unwritten principles of the network (Venturini et al., 2019) and how GV grammatization and Gephi affordances participate in the building and interpretation of the network (Omena & Amaral, 2019), we were able to follow the path of image clusters and understand broadly the dynamics of the Pantanal wildfires image circulation. The analyses made during the data sprint are not yet sufficient to cover the particularities of Pantanal wildfires visual issuefication, further descriptive work, some extra time and efforts are required to complete network exploration and analysis.
The findings are also relevant for research in the fields of platform studies and digital methods. Clearly, there is still much to explore regarding cross-platform circulation of images. The dynamics of image circulation are promising entry points indicators for understanding the relationships among social media platforms and other websites, in terms of grammars, use cultures and infrastructures. However limited in scope and depth, these brief experiments have expanded previous studies in this area (d’Andrea & Mintz, 2019), especially in terms of paths for methodological innovation.
It is important to acknowledge, however, that there are many limits imposed to this effort by the methods themselves. Much has been discussed, thus far, regarding issues in machine-learning-based methods for interpreting images, especially with the case of algorithmic discrimination, among other problems (Crawford & Paglen, 2019; Mintz, 2019; Mintz et al., 2019; Prabhu & Birhane, 2020; Tarcizio Silva, 2019; Tarcizio Silva et al., 2020). In the case of visuals about a very singular ecosystem such as Pantanal, it should also be considered the possibility that Google Vision labels do not accurately identify the diversity of its fauna and landscapes. Also with the case of cross-platform circulation, there are several limitations to be observed in the breadth of the results obtained from Google’s search engine which, as the project coordinators have proposed elsewhere (d’Andrea & Mintz, 2019), performs a horizon of retrievability which cannot be confused with any claim of totality or actuality. According to the best practices in digital methods approach (Omena, 2019; Rieder & Röhle, 2017; Rogers, 2013), all this should be taken with a grain of salt and as a starting point for reflexive considerations, rather than as positivistic descriptions of reality.
Blondel, V. D., Guillaume, J.-L., Lambiotte, R., & Lefebvre, E. (2008). Fast unfolding of communities in large networks. Journal of Statistical Mechanics: Theory and Experiment, 2008(10), P10008. https://doi.org/10.1088/1742-5468/2008/10/P10008
Born, D. (2018). Bearing Witness? Polar Bears as Icons for Climate Change Communication in National Geographic. Environmental Communication, 0(0), 1–15. https://doi.org/10.1080/17524032.2018.1435557
Crawford, K., & Paglen, T. (2019). Excavating AI. -. https://www.excavating.ai
d’Andrea, C., & Mintz, A. (2019). Studying the Live Cross-Platform Circulation of Images With Computer Vision API: An Experiment Based on a Sports Media Event. International Journal of Communication, 13(0), 21.
Faulkner, S., Vis, F., & D’Orazio, F. (2018). Analysing Social Media Images. In J. Burgess, A. Marwick, & T. Poell (Eds.), The SAGE Handbook of Social Media (pp. 160–178). SAGE Publications. https://doi.org/10.4135/9781473984066.n10
Gibbs, M., Meese, J., Arnold, M., Nansen, B., & Carter, M. (2015). #Funeral and Instagram: Death, social media, and platform vernacular. Information, Communication & Society, 18(3), 255–268. https://doi.org/10.1080/1369118X.2014.987152
Harris, M. B., Tomas, W., Mourão, G., Silva, C. J. D., Guimarães, E., Sonoda, F., & Fachim, E. (2005). Safeguarding the Pantanal Wetlands: Threats and Conservation Initiatives. Conservation Biology, 19(3), 714–720. https://doi.org/10.1111/j.1523-1739.2005.00708.x
Jacomy, M., Venturini, T., Heymann, S., & Bastian, M. (2014). ForceAtlas2, a Continuous Graph Layout Algorithm for Handy Network Visualization Designed for the Gephi Software. PLoS ONE, 9(6). https://doi.org/10.1371/journal.pone.0098679
Kaz, R. (2020). 1%. revista piauí. https://piaui.folha.uol.com.br/materia/1-2/
Latour, B. (2004). Why has critique run out of steam? From matters of fact to matters of concern. Critical Inquiry, 30(2), 225–248.
Leaver, T., Highfield, T., & Abidin, C. (2020). Instagram: Visual Social Media Cultures (1a edição). Polity.
Lemos, V. (2020, September 19). As histórias por trás de 3 fotos dos incêndios no Pantanal que viralizaram [19/09/2020]. UOL Notícias. https://noticias.uol.com.br/meio-ambiente/ultimas-noticias/bbc/2020/09/19/as-historias-por-tras-de-3-fotos-dos-incendios-no-pantanal-que-viralizaram.htm
Marres, N., & Gerlitz, C. (2016). Interface methods: Renegotiating relations between digital social research, STS and sociology. The Sociological Review, 64(1), 21–46. https://doi.org/10.1111/1467-954X.12314
Mintz, A. (2019). Visualidades computacionais e a imagem-rede: Reapropriações do aprendizado de máquina para o estudo de imagens em plataformas online [Tese (doutorado)]. Universidade Federal de Minas Gerais.
Mintz, A., Silva, T., Gobbo, B., Pilipets, E., Azhar, H., Takamitsu, H., Omena, J. J., & Oliveira, T. (2019). Interrogating vision APIs. Universidade Nova de Lisboa. https://metodosdigitais.fcsh.unl.pt/smart-2019/project-reports/interrogating-vision-apis/
Omena, J. J. (Ed.). (2019). Métodos Digitais: Teoria‐prática‐crítica. ICNOVA. https://www.icnova.fcsh.unl.pt/metodos-digitais-teoria%E2%80%90pratica%E2%80%90critica/
Omena, J. J., Rabello, E. T., & Mintz, A. G. (2020). Digital Methods for Hashtag Engagement Research. Social Media + Society, 6(3), 205630512094069. https://doi.org/10.1177/2056305120940697
Omena, J. J. . & Amaral, I. (2019). Sistema de leitura de redes digitais multiplataforma. In Janna Joceli Omena (Ed.), Métodos Digitais: Teoria-Prática-Crítica (pp. 121–140). ICNOVA. https://www.researchgate.net/publication/339434985_Sistema_de_leitura_de_redes_digitais_multiplataforma
Omena, J.J. & Granado, A. (2020). Call into the platform! Revista ICONO14 Revista Científica de Comunicación y Tecnologías Emergentes, 18(1), 89–122. https://doi.org/10.7195/ri14.v18i1.1436
Venturini, T., Jacomy, M. & Jensen, P. (2019). What Do We See When We Look at Networks. An Introduction to Visual Network Analysis and Force-Directed Layouts. SSRN Electronic Journal. https://doi.org/10.2139/ssrn.3378438
Prabhu, V. U., & Birhane, A. (2020). Large image datasets: A pyrrhic win for computer vision? ArXiv:2006.16923 [Cs, Stat]. http://arxiv.org/abs/2006.16923
Ricci, D., Colombo, G., Meunier, A., & Brilli, A. (2017). Designing Digital Methods to monitor and inform Urban Policy. The case of Paris and its Urban Nature initiative. Proceedings… 3rd International Conference on Public Policy (ICPP3), Cingapura.
Rieder, B., & Röhle, T. (2017). Digital Methods: From Challenges to Bildung. In M. T. Schäfer & K. Van Es (Eds.), The datafied society: Studying culture through data (pp. 109–124). Amsterdam University Press.
Rogers, R. (2013). Digital methods. MIT Press.
Rykov, Y., Nagornyy, O., Olessia Kolstova, Herbert Natta, Alexander Kremenets, Lev Manovich, Damiano Cerrone, & Damon Crockett. (2016). Semantic and geospatial ,mapping of Instagram Images in Saint-Petersburg. Proceedings… AINL FRUCT 2016 Conference, Saint Petersburg. http://ieeexplore.ieee.org/servlet/opac?punumber=7889413
Silva, Tarcizio. (2019). Visão Computacional e Vieses Racializados: Branquitude como padrão no aprendizado de máquina. Anais… II COPENE – Congresso de Pesquisadores/as Negros/as do Nordeste, João Pessoa. https://www.researchgate.net/publication/334263119_Visao_Computacional_e_Vieses_Racializados_branquitude_como_padrao_no_aprendizado_de_maquina
Silva, Tarcizio, Mintz, A., Omena, J. J., Gobbo, B., Oliveira, T., Takamitsu, H. T., Pilipets, E., & Azhar, H. (2020). APIs de visão computacional: Investigando mediações algorítmicas a partir de estudo de bancos de imagens. Logos, 27(01), 30.
Software references
Chao, J. (2021). Domain Extractor. Available at https://colab.research.google.com/drive/1NE35PpE05U2TngM5P1wdNI3i-TCqm89-?usp=sharing
Gephi Consortium. (2017). Gephi (0.9.2) [Computer software]. https://gephi.org/
Graf, A., Koch-Kramer, A., Lindqvist, L., Peeters, S., & Dāvis. (2019). Instaloader (4.2.8) [Computer software]. https://instaloader.github.io/
Mintz, A. (2018a). Image Network Plotter. https://github.com/amintz/image-network-plotter
Mintz, A. (2018b). Memespector Python. https://github.com/amintz/memespector-python
Rieder, B., Den Tex, E., & Mintz, A. (2018). Memespector. https://github.com/bernorieder/memespector