
Digital Media Winter Institute 2018
SMART Data Sprint: Interpreters of Platform Data
29 January – 2 February 2018
Universidade Nova de Lisboa | NOVA FCSH | iNOVA Media Lab
Project title: Mapping Femicide Discourses on Twitter
Project leader: Inês Amaral
Team members: Alexandra Rodriguez | Aubrey O’Neal | Beatrice Gobbo | Frederico Fonseca | Mara Semyra | Rodrigo Silva | Tanja Bosch
Project pitch slides: Mapping Femicide Discourses on Twitter
»Introduction
»Research Questions
»Dataset Visual Protocol
»Methodology (methods, tools, approaches of data analysis)
»Findings
»Conclusion
»References
Key Findings
—> The main users in the network around femicide were feminist organisations and activists. Journalists and citizens were not central actors within this specific network.
—> The most active users were not always the most visible users.
—> There was not always a clear relationship between keywords and hashtags; often keywords were more prevalent than hashtags.
—> The most RT content was mostly images and videos – however, the most shared images were related to events, and usually carried additional contextual information such as captions. Censored images were rarely shared.
—> Twitter plays a role in forging solidarity (versus merely sharing information)
—> Networks are primarily content based (versus conversation based)
—> Our analysis reveals the prevalence of connective action (Bennett & Segerberg, 2012) and individualised collective action (Micheletti, 2003).
»Introduction
The Internet embodies a world of mediated social interactions, where communication is decontextualized several times through disaggregated streamings. Analysis of activity on social media platforms reveal individual behaviors based on and in networks. Computer mediated communication platforms are used to create ties and capital through decontextualized social representations.
There are patterns of connectivity that metamorphose the digital culture (Jenkins, 2006) and allow identifying content-based networks and conversation-based networks. Social networks based on semantic indexation of content enable the analysis of content systems, interactions and social representations based on micro-conversations in a distributed production perspective that induces collective consumption (Huberman, Romero & Wu, 2009). Asymmetric social networks maximize the networked individualism model (Wellman & Gulia, 1999; Castells, 2000; Recuero, 2009) and isolate social properties of digital communication. The new sociability without territory promotes the social density of networks on a continuum, based on new practices that derive from collective-oriented objects (Rogers, 2013) and user metadata (Amaral, 2016). In this project we analyse the discourses about “femicide” on Twitter in order to identify the dominant voices, representations and connections through content.
»Research Questions
How is activism around discursive violence against women mobilised on Twitter?
a) What is the dominant discourse about “femicide”?
-
- Who are the dominant voices?
-
- How do the main hashtags and words contribute to the construction of discourses around femicide?
-
- Is there an engagement through content that is connected to the dominant discourse propagated by the most commonly used hashtags? Who are the central actors? Who are the most influential actors? What are the most prevalent hashtags?
- What is the visual culture?
b) Which communities are created through “hashtag networks”, social graphs of mentions and interaction networks?
-
- How does communities are related through hashtags?
-
- Is possible to visually categorise the identity of the main clusters?
-
- Which discourses are mobilised by the ties between communities?
-
- Does the data reveal a logic of connective action?
- What are the patterns that hold the networks?
»Dataset Visual Protocol
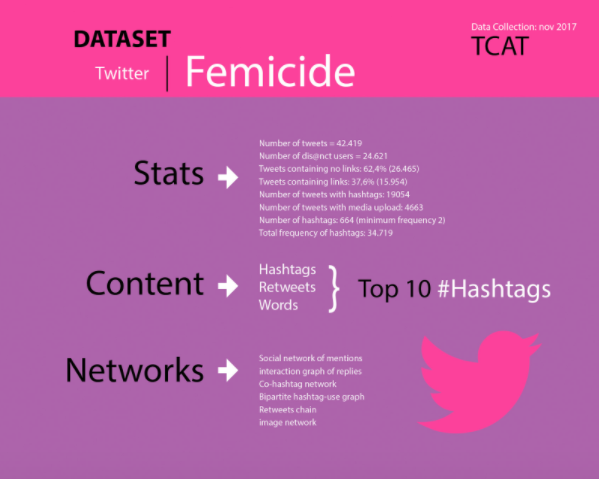
The dataset was collected through DMI Twitter Capturing and Analysis Toolset (DMI-TCAT). Data were collected through the Twitter search query “feminicidio” (Portuguese and Spanish word for femicide) during the month of November 2017.
The dataset consists of 42.419 tweets and 24.621 distinct users. All tweets contain the term ‘feminicide’, 19.054 tweets have hashtags, 15.954 tweets contain links, 4.663 tweets have media upload. From a minimum frequency of 2. 664 hashtags were identified with a total occurrence of 34.719.
»Methodology
Mixed methods were applied in order to answer to the research questions. Network analysis were combined with quantitative and qualitative content analysis, and digital methods of visualization.
The tools used in this project were: 1). Raw; 2). Google Vision Api; 3). Gephi; 4). Excel (basic and advanced); 5). Adobe Illustrator.
Approaches for data analysis:
- Users
Our first step in the analysis of users was to attempt to establish who the most prominent users were in the network i.e. who tweeted the most on the topic of femicide using the various hashtags; as well as who the most influential users were in the network, i.e. which users were most visible. We thus made a clear distinction between the most active (tweeting the most) and the most visible (most mentioned) users, in order to compare whether there was a correlation between activity and visibility. Using the dataset, we categorised the top 10 users in each category, and using Excel and Raw Graphs, created a visualisation to show the relationship between the most active and the most visible users.
- Content
Our analysis of the content took several forms. Firstly we explored the words (not the hashtags) that appeared most often in the dataset. We made a clear distinction between words used in tweets versus hashtags, and used Raw Graphs to create a visualisation of the most commonly used words.
We also analysed the content that was retweeted most often, conducting a visual qualitative content analysis on the images and videos in the top 10 most retweeted tweets. We organised the data using Excel. First we used the open-source tool Table2Net, importing the CSV file for analysis, which allowed us to extract the network from the table. We then exported the network .gdf file. We then used Gephi to analyse the network file, to sort the items by text, which gave us usernames and retweets. Sorting by occurence allowed us to identify the most retweeted items, and to analyse this network of the most retweeted items. The network was visually worked using Gephi and Adobe Illustrator.
- Hashtags
For the categorization, we approach to the hashtags we started using qualitative and quantitative content analysis. We analyzed the most frequent hashtags than has been used at least 10 times. Looking for similarities between the different ideas shared (cities, causes, events…) we established the categories. We organised this data using excel and created a visualisation using Raw Graphs to show the distribution of the hashtags per each of these categories.
Through TCAT we have collected the co-hashtag network from the top 500 hashtags. We organised the data in Excel. Then we analysed the co-hashtag network using Gephi to generate an undirected graph in order to explore the relations between hashtags, identify communities, visually represent them and identify bridging nodes.
- Image Networks
Using the Google Vision API, we analyzed the most frequently shared imagest in the month of november (n = 80). GV returns a list of attributes about the image, and for this study, we took labels (objects found in the image) and web entities. We then created an image network through Gephi, in which images were the nodes and attributes were edges. Next, we did a qualitative analysis of the clustered images, to look for themes in pictures that are commonly shared on Twitter. This also included background research to contextualize individual images. Finally, we qualitatively compared most shared images to least shared images. The network was visually created using Gephi and Adobe Illustrator.
- Social Networks
Using Gephi, we generated a social mention graph. First we selected the top users by number of mentions (n = 500). Then we analysed a directed graph based on interactions between users. If a user mentions another one, a directed link was created. In order to compare patterns in communication with the social mention graph, we use Gephi again to generate a directed interaction graph based on the replies. Both networks were visually created using Gephi and Adobe Illustrator.
»Findings
- Users
As shown in Figures 2 and 3, whoever has the most (activity) are not the most influential actors (visibility) and vice versa. The most visible actors are feminist organizations, alternative media and activists. Most are from Spain and Mexico.
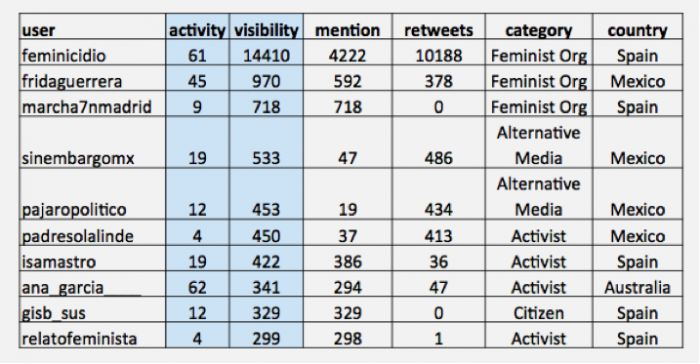
Figure 2 – Most influential users in the network
Although they are all Hispanic (Spain, Mexico and Venezuela), there is greater diversity in the actors that have more activity in the network. Alternative media, media professionals, activists and feminist organizations are the most published tweets.
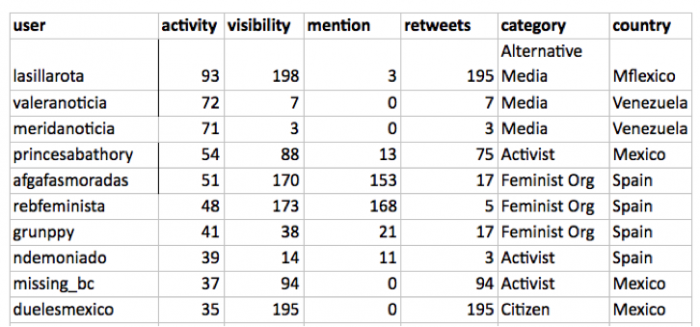
Figure 3 – Most active users in the network
- Content
The most frequent words in tweets are in Spanish and refer to women (9126), victim (s) (3351), violence (2777), murdered (2285), “puebla” (1481), justice (1276) ), male (1265), kill (1210), husband (1163), manifestation (1144), patriarchy (1055), male chauvinist (994), complaint (987) and impunity (936).

Figure 4 – Main keywords used on Twitter in relation to femicide
As Figure 4 show, majority of the most retweeted tweets are about the “La Manana” and the “Calcetillas rojas” cases. The content of the RT are mostly images and videos – these tweets had the most impact with Twitter users, who attached significance to them by retweeting them. While the highest RT is not by a user that is central in the network, all the other most RT tweets are from @feminicidio, the most central user in the network. The 8th most RT tweet was by a priest, Alejandro Solalinde, who also emerged as one of the key actors in the network. Many of the RT do not contain the most used hashtags in the overall dataset. Most of the RT deal with solidarity – women’s agency; versus Gerbaudo’s notion of Twitter playing a role as a “choreography of assembly”.
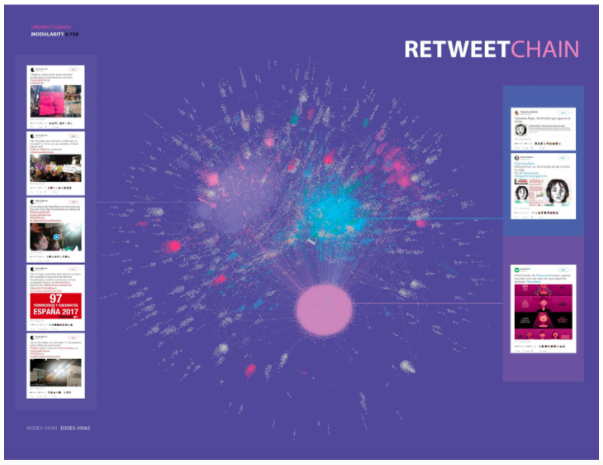
Retweets Chain Information
Nodes: 34.583
Edges: 43.062
Modularity: 185 (0,732)
Components: 147
- Hashtags
We analysed the 664 different hashtags used and categorized those that appeared more than 10 times during the period analysed. This parameter resulted in a small data set of 287 hashtags which we then further analysed. Using qualitative content analysis, we created 12 categories of hashtags:
-
- Places (n = 71; occurrences = 6113 )
-
- Online Campaigns (n = 43; occurrences = 7982)
-
- Types of Aggressions (n = 21; occurrences = 8999)
-
- Events (n = 13; occurrences = 3203)
-
- Feminist Terms (n = 18; occurrences = 1438)
-
- Causes (n = 13; occurrences = 1296)
-
- Demands (n = 10; occurrences = 385)
-
- Legal Justice Issues (n = 5; occurrences = 286)
-
- Institutional (e.g. government bodies) (n = 11; occurrences = 587)
-
- Media (n = 44; occurrences = 1796)
-
- Communities (n = 3; occurrences = 120)
- Others (n = 35; occurrences = 837)
In order to understand how connective networks of users are clustered around specific hashtags, we draw a network of hashtags communities through a bipartite graph based on co-occurrence of hashtags (edges) and users (nodes). In the Figure 6, we see that there are 7 main clusters around the top most frequently used hashtags, but there are also many additional small communities. These peripheral communities surround specific cases.
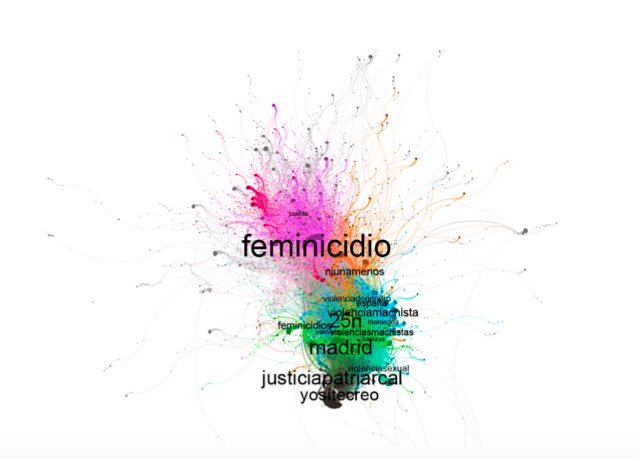
Figure 6 – Hashtag Clusters
We draw an undirected graph based on co-word analysis of hashtags, which means that hashtags that appear in the same tweet are linked. In this graph are only considered the top of 500 hashtags. As shown in Figure 6, this network has 1525 nodes and 1115 edges. The links between the hashtags #feminicidio, # 25N and #Madrid are the strongest, these being the central nodes.
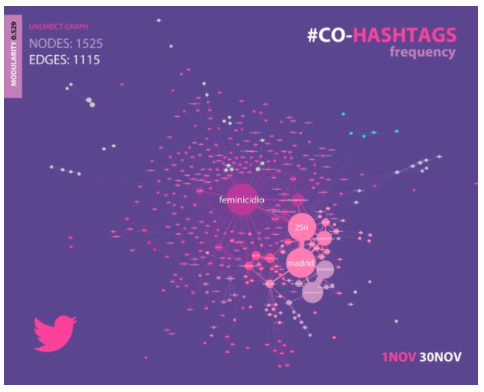
Figure 7 – Co-Hashtag Networks
- Image Networks
Image Categories
Based on google vision finding we can establish 10 categories of images:
-
- Protest (11/25 and 11/17)
-
- Murders
-
- Crime Scene
-
- Perpetrators
-
- Beauty
-
- Unrelated
-
- Stock Photo
-
- Vectors and Premade Signage
-
- Hashtag Hijacking
- Network Isolate
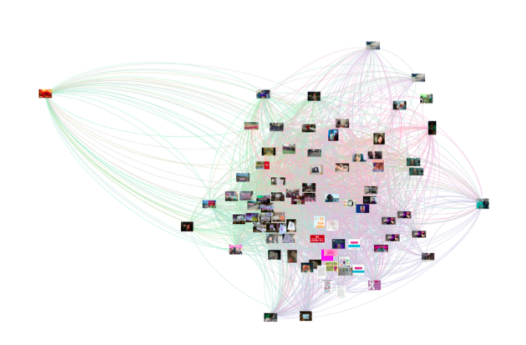
Figure 8 – Image Networks
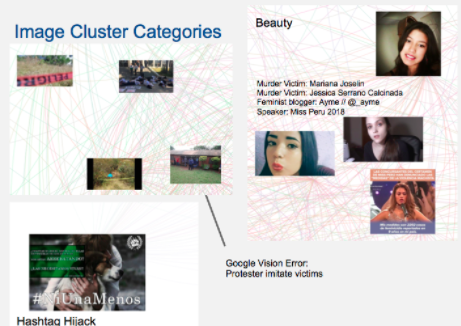
Figure 9 – Example of Image Cluster Categories
What images are shared?
More information/text tended to get images of specific murders. Images that were censored are had little context are not shared.
- Social Networks
Figure 10 shows a directed graph based on interactions between users. This means that if a tweet was written in reply to another one, a directed link is created. The network is very scattered (density = 0.008; diameter = 9), with 500 nodes and 1874 edges. With a modularity of 0.396, 160 communities were identified. The network allows to understand that the weak loops are reason for its expansion, being that the average geodesic distance is of 3.25 and the average degree of 3.75. We identified 324 strong components and 149 weak components.
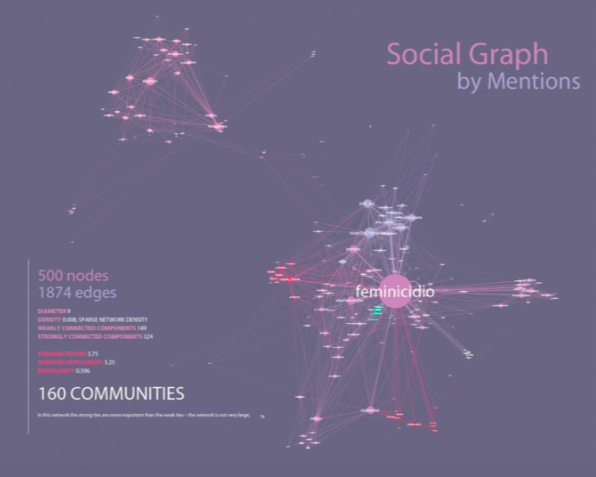
Figure 10 – Social Graph
The network of interactions between users assumes a minimum frequency of 4, including 4416 nodes and 2854 edges (connections between users by mentions), and allowing to identify 1562 communities. The network is very dispersed, with a diameter of 16. We identified 1562 weakly connected components and 4416 strongly connected components. These data underline the importance of weak ties and a content-centric network rather than conversation, as shown in Figure 11.
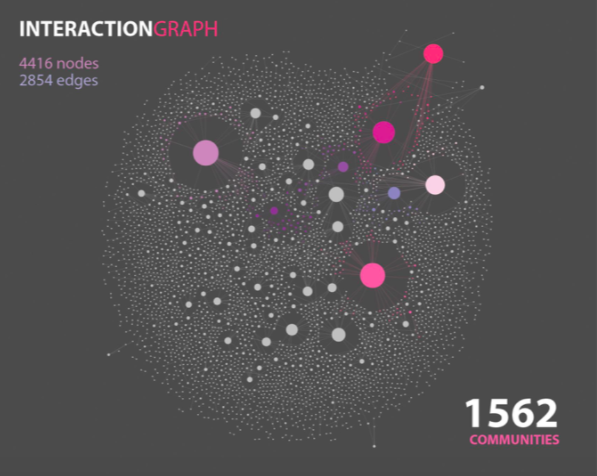
Figure 11 – Interaction Graph
»Conclusion
Internet can be defined as a public space that promotes collective action (Zheng & Wu, 2005; Langman, 2005; Loader, 2008). One of the intersections between micro and macro participations relies in audience action, which is essentially based on the use of technology. Digital media environment is, itself, a change in the context for action (Bimber, 2017) and it increases opportunities for action (Bennett & Segerberg, 2012; Kavada, 2016).
The main findings allow us to identify content-based networks and conversation-based networks through the perspective of “individualized collective action” (Micheletti, 2003). As an interaction of micro- and macro-participation, the six networks (social network of mentions, interaction graph of replies, co-hashtag network, bipartite hashtag-use graph, retweets chain and image network) that we analyzed are a consequence of collective action and also of individual participation. Therefore, the networks analysed are content-based and not a conversation-based.
A key finding of this exploratory project is that digital ecosystem support asymmetric social networks of individuals enables strong ties to be strengthened but, above all, to maximize and expand weak ties (Granovetter, 1973) that sustain and mobilize collective action (Amaral, 2016). As Bennett and Segerberg stated, “personal action frames do not spread automatically” (2012, p. 746). The authors distinguish the “logic of collective action” from the “logic of connective action” (Bennett & Segerberg, 2012). The ‘logic of collective action’ coexists with the new emerging model that arises from the referred “individualized collective action” (Micheletti, 2003) and materializes itself in ‘digitally network actions’. The model of the ‘logic of connective networks’ is based on networks that are “typically far more individualized and technologically organized sets of processes that result in action without the requirement of collection identity framing” (Bennett & Segerberg, 2012, p. 750). Therefore, the “logic of connective action” (Bennett & Segerberg, 2012) emphasizes the contribution of the individual, which is a key finding of our study.
Acknowledgement
The process of data collection for this project was supported by the National Distributing Computing Infrastructure, Portugal.
»References
Amaral, I. (2016). Redes Sociais: sociabilidades emergentes. Covilhã: Editora LabCom.IFP.
Bennett, W. L. & Segerberg, A. (2012). The logic of connective action: Digital media and the personalization of contentious politics. Information, Communication & Society, 15(5), 739-768.
Bimber, B. (2017). Three prompts for collective action in the context of digital media. Political Communication, 34(1), 6-20.
Castells, M. (2000) ‘Toward a Sociology of the Network Society’, Contemporary Sociology, 29 (5): 693-699.
Granovetter, M. S. (1973). The strength of weak ties. American journal of sociology, 78(6), 1360-1380.
Huberman, B. A., Romero, D. M. & Wu, F. (2009) ‘Social networks that matter: Twitter under the microscope’, First Monday, 14 (1).
Kavada, A. (2016). Social movements and political agency in the digital age: A communication approach. Media and Communication, 4(4), 8-12.
Micheletti, M. (2003). Shopping with and for Virtues. In Political virtue and shopping (pp. 149-168). Palgrave Macmillan US.
Recuero, R. (2009) Redes Sociais na Internet, Porto Alegre, Sulina: Editora Meridional.
Rogers, R. (2013). Digital Methods. Cambridge, MA: MIT Press.
Wellman, B., & Gulia, M. (1999) ‘Net Surfers donʼt ride alone: virtual communities as communities’ in Wellman, B. (Ed.) (1999) Networks in the Global Village, Boulder, CO: Westview, pp. 331-366.