
Gramming #covid19, reframing the pandemic: Exploring how algorithms and user practices shape COVID-19 imaginaries on Instagram over time.
Project leader (s) / facilitator (s)
Elias Bitencourt
Associate Professor, The State University of Bahia, Brazil; Adjunct Professor, Federal University of Bahia, Brazil; Researcher of LAB404/UFBA
João Guilherme Bastos dos Santos
Post-doc researcher at the Brazilian National Institute of Science and Technology for Digital Democracy. (INCT.DD); Ahead of INCT.DD’s Data Science for Digital Communication Laboratory (C2D2).
Project Team
Anna Schjøtt Hansen
Research Assistant at Roskilde University, Denmark, part of the DataPublics project
Charis Papaevangelou
PhD candidate at LERASS, Université Toulouse III – Paul Sabatier, France; JOLTETN, H2020/Marie Sklodowska-Curie fellow
Caterina Foa
PhD candidate at Iscte-IUL, Lisbon; Researcher at MediaLab CIES-IUL
Luís Junqueira
Invited Researcher, SafeConsume Project, Institute of Social Sciences – University of Lisbon
Project pitch slides
Final presentation slides
Key Findings
Introduction
Research Questions
Query Design & Visual Protocol
Methodology
Findings
Discussion
References
This sprint project set out to investigate how the entangling of Instagram’s algorithmic mediation and user practices shaped the imaginary of Covid-19 over time. We explore 4.393 posts from 3.9 unique authors over the span of 2 weeks. Our explorations observed the arrangements of three main dimensions associated with the most visible content on the network and analysed them through an original multimodal approach. The three dimensions were: 1) platform affordances, 2) platform grammars appropriations by different user profile classes and 3) practices and metrics related to social network marketing strategies. The multi-methods approach combines metrics’ profiling with a) analysis of platform vernacular practices, b) image analysis, c) network analysis and d) lexical analysis.
Our main findings are:
- The imaginary of Covid-19 was highly segregated into smaller ‘sub-conversations’ that often did not have a clear relation to the health pandemic situation. We identify that the #covid19 is used as a tool to promote visibility of various agendas (e.g. arts, fitness, beauty, food etc.), so the covid theme becomes diluted, gains new appropriations of meaning and becomes invisible as a public health issue topic on Instagram
- Different user profile classes can reveal diverse cultures of use and alternative modes of grammar appropriations and this may interfere not only in terms of content interests (which is already widely known) but also create different content regimes of visibility that may compete for algorithmic “attention” on the platform.
- Mapping hashtag usage practices by different user profile classes and co-occurrence networks can help to highlight the platform vernaculars that may characterize each hashtag cluster providing important insights to better understand different regimes of visibility and content circulation in dispute on the network.
- Lexical analysis sheds light into competing vocabularies shaping the discussion on Instagram, from public health to instagood, from government affairs to domestic market. Each stream has a particular vocabulary, related to user profile classes ranging from mega influencers to common users.
Introduction: Algorithms and platform imaginaries
The COVID-19 pandemic has accelerated processes of platformization (d’Andréa, 2020; Van Dijck, 2020; Van Dijck et al., 2018), allowing digital infrastructures to play a more active role shaping our social organization. For many of us at the moment, these platforms are the main (or the only) way to have access to work, education, health services, food, leisure and sociability.
Generically treated as a window to the world during isolation, these platforms are characterized by complex (and tricky) regimes of visibility. What one can see or have access to is deeply affected by algorithmic segmentation and recommendation systems (Bucher, 2012, 2017a, 2018; Gillespie, 2016, 2018; Lemos et al., 2020; Rieder et al., 2018).
These algorithmic regimes of visibility have specific weights and rules that affect not only on which themes, contents, narratives and world-views will be accessible, but when they will be, who will be able to see them (Bitencourt, 2019; M. Geboers et al., 2020; M. A. Geboers & Van De Wiele, 2020; Hallinan & Striphas, 2016)and which images are more willing to be rewarded.
To operate properly, platforms’ algorithms need to create favorable conditions for the subsistence of the media ecosystem as a whole. Though computational infrastructures are well known as inaccessible “black boxes”, we can study their effects without necessarily exploring the algorithms themselves from the backend (Bitencourt, 2021; Bucher, 2017b, 2018; Dieter et al., 2019; Gerlitz & Rieder, 2018; Marres & Gerlitz, 2015)
Exploring the entanglements among the aforementioned variables as favorable conditions for the phenomenons’ existence (Latour, 2013; Souriau, 2015; Stengers & Latour, 2015) is an alternative way of inquiring algorithmic performativity without undermining or overestimating the digital mediations involved.
Thus, this project is an attempt to explore what we will call the “COVID-19’s Instagrammable imaginary”: a set of specific subjects, values and verbal material concerning quarantines imposed due to the pandemic of COVID-19, that are promoted on Instagram through specific arrangements of the platform’s affordances and users’ practices. We seek to map these arrangements in order to understand when do Instagram algorithms matter and how they would shape the COVID-19 posts’ visibilities on the platform over time.
The role of Platform’s digital materialities on shaping content visibility
One way to start these explorations is by observing how interactions and uses are ordered through the restrictions and permissions established by the user interface (buttons, features, rankings, classes, profiles, groups) and general platform affordances (such as metadata, metrics, software features, terms of use, privacy policy and so on). Together, these aspects affect the construction of informational actions’ repertoires (Marres, 2017; Marres & Gerlitz, 2015): a chain of communication practices guided by (and for) specific grammars from each platform, such as “tag users”, “insert georeferenced data”, “like”, “share”, “post”, “create a reel”, “use a filter”, “make a story”, “follow users”.
These “platform grammars” (Gerlitz & Rieder, 2018; Rieder, 2013) are fundamental epistemological units for classification and algorithmic recommendation systems, since they guide all platform’s processes, from ordering network interactions to content access and moderation. (Gillespie, 2016, 2018; Rieder, 2020; Van Dijck, 2020)
Perceptions about algorithms’ parameters among content producers whose economic and political aims depend on adaptation to its grammar, foster investments in the so-called search engine optimization (SEO): specific ways of engaging with content and expressing to try ‘hacking’ the algorithm and gain visibility. This perception, more than the actual algorithmic functioning, can be traced through evolving practices, patterns and vocabularies seen in these platforms.
Although these “platform grammars” can be immediately associated both with the affordances available as users’ features and with the most popular metrics offered by each service, the scope of their agencies goes beyond what is visible on the screens. Reflexes of this grammatization are distributed throughout the platform stack – user policies, privacy terms, metadata –, embedded on the specific communication practices of each platform – e.g. “platform vernaculars” (Gibbs et al., 2015) –, and popular routines focused on increasing the performance of profiles based on alternative parameters created by digital marketing companies (Arriagada & Ibáñez, 2020).
Hence, it is important not only to look for the most popular metrics (Rogers, 2018), but also for the way in which they create conditions for algorithms to act, guiding usage practices, modeling networks and boosting the visibility of certain themes on the platform (MACHADO et al., 2020; Omena et al., 2020; Omena & Amaral, 2019). It means that it is necessary to take into account that the engagement metrics (usually associated with the highlighting of content on a network), not only vary from one ecosystem to another, but also say very little about the profile or content visibility if analysed separately.
Given the relevance of profiling, the chances of a content being algorithmically promoted will always depend on what becomes more or less visible to the specific segment ascribed to the user. Visibility varies according to each micro-network (niche or community) receiving this content on the platform. On Instagram, these micro-networks are dispersed, and organic infrastructures modeled by countless momentary arrangements among the followers of a profile, the profiles identified as correlates and their respective audiences.
Case Study: Gramming #covid19, reframing the pandemic
Our overall goal is to try to explore evidence that allows us to think, in a situated way, about the role of algorithms in the construction of the imaginary about COVID-19 on Instagram over time. In this study, we focused on mapping the arrangements among the grammars used in the posts, the vernacular practices and the affordances of the platform valued by the recommendation algorithms and which could be associated with increasing or decreasing the visibility of the contents on the network. We understand that many posts can reach visibility without converting it into engagement and, therefore, posts with high engagement compose a specific group among posts with high visibility. Also that the value of any engagement rate needs to take into account the size of the segment in which it is inserted and the audience related to the profile posting it.
According to the most recent changes in Instagram’s recommendation algorithms, the relevance of a content is strongly linked to the relationship between correlations, similarity and recency regarding user practices, content engagement and platform affordances usage. Simply put, the algorithmically relevant content is based on the most recurring arrangement patterns among the ways of using grammars (vernacular practices), circulated content, platform affordances and audience reaction to content in relation to the most recent experiences either on the general network and in the micro-networks to which each profile is connected.
This implied thinking about quantitative and qualitative metrics (such as post engagement rate, the number of followers of the profiles), not as immediate references of what is or is not relevant on Instagram, but as traces that would allow identifying the sociomaterial arrangements possibly associated with the modulations of visibility on the platform. Its meaning needs to be understood in relation to diverse profiles’ vocabularies, the strategic use of hashtags and how these elements are entangled over time. That is, we explore some of Instagram affordances parameters as strategies to identify platform grammar usage and appropriation practices (Platform vernaculars) that could lead recommendation systems to prioritize certain patterns that are trending on specific micro-networks as patterns of general interest in the platform.
In an attempt to respond to some of these methodological challenges, we have designed a multi-sited and over time approach which combines qualitative and quantitative analysis parameters used by social network marketing, network analysis procedures, automated lexical analysis and interface methods insights.
Our corpus was built from 4.3k Instagram posts containing the hashtag #covid19 published by 3.9k unique users. Posts were scraped from Dec 30th and Jan 12th and re-scraped a week after the publication date in order to track the posts’ performance over time. Our final database also included author profile metadata for each post, basic metrics provided by Instagram API and other derived parameters oriented to our analysis. Further details on procedures, methods and tools are detailed in the methodology section.
Research Questions
- Are there any verifiable patterns in Instagram’s main grammar usage? Do they vary over time or according to different user profile classes on the network?
- Do different ways of platform grammar usage by different user profile classes affect the quality of engagement or the visibility of Covid-19 posts on the network?
- How do communities and clusters in the network organize themselves according to these grammar usage patterns and user profile classes? What would characterize these communities in terms of covid-19 content and posts’ engagement quality?
- Are there differences among covid-19 lexicon and pandemic topics shared within these clusters? Do they vary depending on the distribution of different user profile classes within the clusters?
Query Design & Visual Protocol
To start exploring the research questions, we chose the most popular hashtag about covid on Instagram. At the time of post data collection, #covid19 had over 39 million linked publications. We monitor variations of our query hashtag usage during the data collection period and note that, despite the fluctuations, its popularity trend has remained. (Pic. 1)
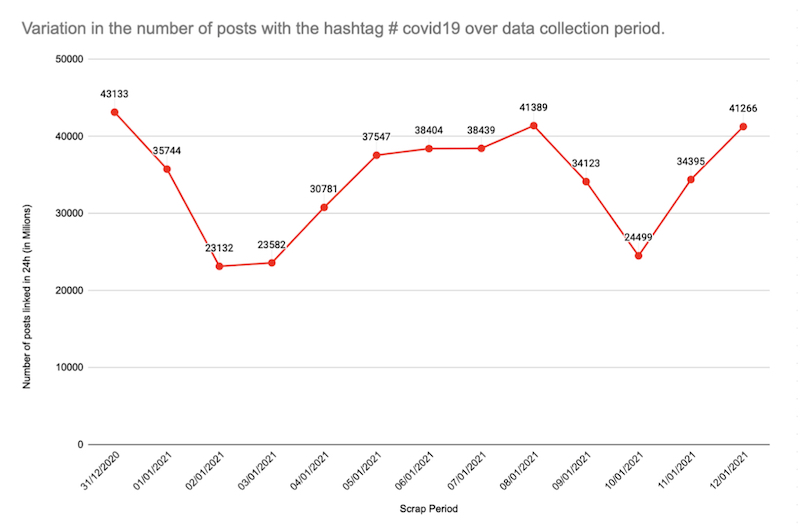
Pic. 1 Number of posts with the hashtag #covid19 during the data collection period. Values were taken from Phantom buster extraction reports.
To extract the posts, we followed a hybrid protocol. First, we used the “Instagram Hashtag Collector module on the Phantom Buster. Then we inserted the list of post’s links obtained by the “Instagram Post Data Extractor” module. This step allowed us to collect the post authors’ usernames. We then created a new list of links with these authors’ profiles and used the “Instagram Profile Scraper” module to obtain the metadata for all profiles. The information was later used to a) classify the profiles, b) to qualify the relationship between followers and following (Follow Ratio -FR), c) to calculate engagement (ER) appropriately (total reactions divided by the number of followers of each author profile) and d) to qualify the engagement in proportion to each profile class. We repeated this procedure for two weeks (from December 30, 2020, to January 12, 2021).
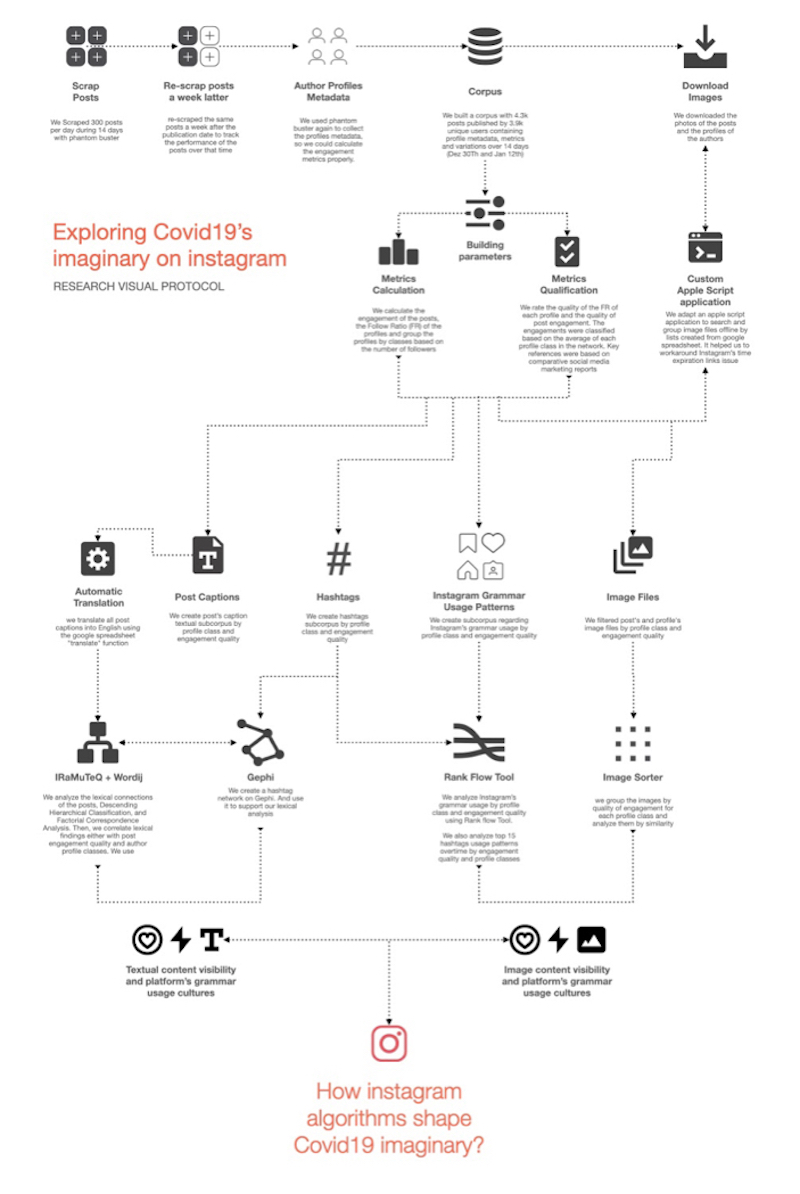
Pic. 2 Research protocol. Image Credit: Elias Bitencourt
We used 15 recently created Instagram accounts in order to carry out the data collection process. All accounts followed the same profile (Instagram official profile) and liked the first post that appeared on feed. We rotated between accounts to ensure that they remained active during the collection period. Due to the newness of accounts used in post extraction, our data may be influenced by Instagram’s “cold start” recommendation mechanisms. Further analysis using profiles with specific content engagement may result in different outcomes.
Our preliminary results from the first scrapes showed that most of the posts gathered had zero likes and comments and were published on average 24 seconds before the data was scraped. This created an issue, as it made the engagement calculations (ER01) unfeasible because the posts did not have time to circulate, creating a bias toward classifying almost all of the posts as “bad engagement” posts.
We explored the platform’s documents and noticed that in December 2020 Instagram had made an algorithmic change and began to privilege recency of the posts in their “explore” recommendations, which was reflected in the data set collected, which was dominated by newly posted posts without or with limited engagement metrics.
This required us to review the protocol and adopt a different approach, where we did not simply extract posts, but monitored their performance over time. This was done by extracting the links from the posts that were initially scraped and then re-scraping them a week later (after their post date) using the “Instagram Post Data Extractor” Phantom Buster module. We use this updated data to calculate a new engagement (ER2) that was used as a filter for our analysis.
We excluded posts that were deleted during the period between the first and second scraping process or posts whose authors’ profiles were no longer available, making it impossible to capture metadata. Our final corpus was made up of 4378 posts produced by 3929 unique users. In processing the data we grouped both the post data and author metadata into a single Google spreadsheet. To optimize the analysis process, we used regular expressions to separate hashtags, profile mentions in the posts, profiles tagged in the posts’ photos, emojis used in posts’ captions. We also calculated the average number of words and hashtags used in each post and automatically translated the posts ‘captions into English.
Given the complexity of platform assemblages and entanglements (such as ranking systems, platform affordances, platform grammars usage cultures) we follow eight general steps to facilitate our approach during the sprint activities.
First we classified the user profiles according to the number of followers. We used social media marketing benchmark reports as a reference and created a custom classification framework better suited to our corpus characteristics (Table 01). A more detailed description of the classification process can be found in the methodology section.
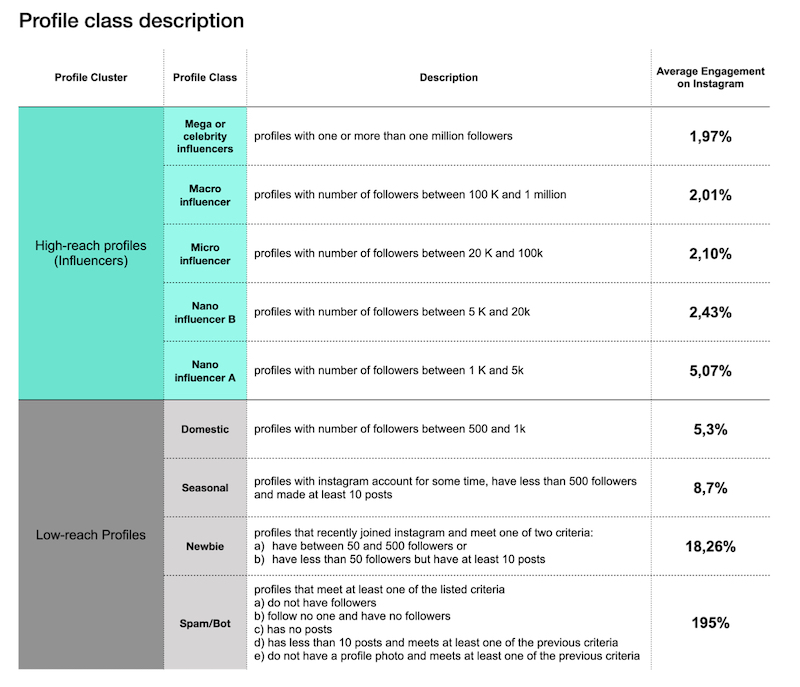
Tab. 1 Index of profile clusters, profile class description and average of engagement references by profile class.
Secondly, we calculated the final post engagement rate (ER2) by adding the total likes and comments of the posts (after one week from the posting date) and then dividing it by the number of followers of the author of the post (Tab. 2).
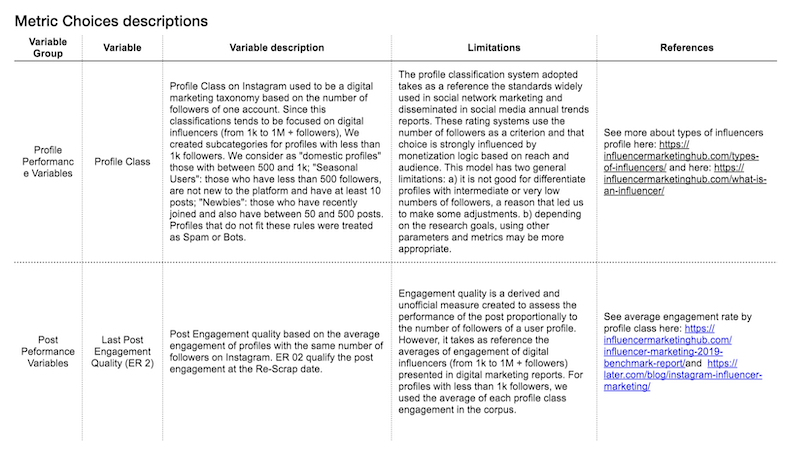
Tab. 2. Index of key metrics with brief descriptions regarding the limitations and references used to build the profile class taxonomy and post engagement quality system.
Third, we rated the quality of the engagement based on the average engagement of each profile class on Instagram. For profiles with more than 1k followers, we used the reference values available in social media marketing reports. For profiles below 1k followers, we used the average engagement of the profile class in the corpus. Posts with engagement below the average engagement value for each profile class were considered “Bad Engagement”, posts with engagement equal to the reference value were considered “Good Engagement” and posts with engagement above the average engagement value for each profile class were considered to be “Very Good Engagement” posts. In our corpus, only posts with “bad” and “very good” engagements were found, which is probably due to the choice to make “good” engagement equal to the reference value, which few posts would be likely to fully match. (See table 1 and 2)
Fourth, we downloaded all the profile pictures and post images before the Instagram links expired. To facilitate the searches involving the downloaded content, we linked the image file names to the posts ID’s in our spreadsheet and adapted an Apple Script that allowed us to search and extract the images already saved using custom lists.
Fifth, we created the lists using post engagement quality and profile class parameters as filters in our Google spreadsheet. Indeed, these two parameters were the main operators used in the four fronts of analysis adopted by our methodology: a) analysis of platform vernacular practices; b) analysis of image patterns, c) network analysis and c) lexical analysis.
Sixth, considering that hashtags are the most important Instagram grammar and the source to our queries concerning #covid19 (from which we identified users mentioned in the previous steps), we identified which other hashtags occur together with #covid19 and how they were connected across the posts in our analysis.
Seventh, hashtags are used to compose bipartite co-occurrence networks (posts/hashtags) to be analysed using the Louvain algorithm (‘modularity’ in Gephi’s Statistics tools) to detect communities. We look more carefully to the communities encompassing more than 4% of the network’s nodes. The resulting metrics are updated to our main table, enabling the insertion of this network dimension (corresponding communities) in further analysis. It allows us to define how hashtags interconnect posts across diverse communities discussing Covid on the platform.
Eighth, the text of the posts is used as a base for lexical analysis through two different methods. First we use R Interface for Multidimensional Analysis of Texts and Questionnaires (IRaMuTeQ) written by Pierre Ratineau to do a Descending Hierarchical Classification and find diverse profiles’ vocabularies involved in this debate and also a Factorial Correspondence Analysis (FCA) to understand how far or close they are from each other. Secondly, we use WORDij in the same original corpus of text to build a table of interconnected words (based on proximity and co-occurrence) and analyse it using Gephi modularity/Louvain algorithms to identify words’ clusters. Considering that this second analysis is not restricted by profiles’ vocabularies, but considering all word pairs appearing recurrently, it could point out if our first analysis misses any important topic. We then compare the results to check if both analyses are coherent. It enabled us to confirm that both our lexical and network analysis parameters are consistent.
To understand the circulation of information about Covid-19 on Instagram we need to explore not only how algorithms may or may not privilege certain information, but the types of inputs produced by users in contact with these algorithms in an environment influenced both by algorithmic and voluntary segmentation. The reciprocal influence among visibility, hashtag’s use, the platform’s vernacular practices involved, as well as the different types of profiles (from celebrities to regular users), requires a methodology combining these different factors and related methods.
More specifically, starting from a single hashtag, we identified: a) the profile classes that circulated content linked to our query’s hashtag, b) the variations in the hashtag usage patterns and their correlation to each profile class and posts’ engagement quality, c) the hashtag networks, the clusters that compose it, its specific lexicons and vocabularies that characterize the main lines of discussion.
We start by mapping the contents, the profile characteristics of those who circulate them, and the platform’s grammar usage pattern related to these profiles’ groups. Then, we combine these approaches in order to explore possible correlations between the platform’s grammar usage patterns (vernacular practices), the quality of post’s engagement and the vocabularies characterizing the main perspectives on the theme (lexical analysis), their specific niches inside the network of hashtags and posts interacting with #covid19 (network analysis), the visual patterns of posts’ image circulated (image analysis) and the platform’s grammar usage patterns and their variations either by profile classes and by time period. Each step is described in detail in the following sections.
Platform’s Grammar Usage Patterns
We hypothesize that different arrangements in the use of grammars and profiles with different reach potential could affect the type of content circulated under covid labels. So, our attempt at this point was to map the main grammars used in the posts and establish a correlation between the usage patterns, the quality of engagement and the profile classes.
The grammar usage analysis adopted two approaches, the first one was based on changes over time. The second was focused on mapping user practices regarding platform grammar appropriations. We did it using profile classes and post engagement quality as a filter criteria to map both image content and hashtag usage patterns.
1) Over time analysis
For time based analysis we created four sub-corpora a) all posts with high engagement; b) all posts with low engagement; c) Posts with high engagement separated by different profile classes; d) Posts with low engagement separated by different profile classes.
We formatted all sub-corpora to be used in the 4Cat tool (PEETERS; HAGEN, 2018) from where we could extract most popular hashtags fluctuations throughout the days. We filter these results and use Bernard Rieder’s rank flow tool (2016) to produce the visualizations. Then we edit the files in vector software such as Affinity design and group the hashtags of the same theme by color.
From these steps, it was possible to verify not only the fluctuation pattern of hashtags in high and low engagement posts, but to identify which themes were most frequently associated with different profile classes, which were more present in high or low engagement posts and possible contrasts in hashtags usage patterns.
2) Post’s image analysis
We decided to explore the images in the posts to find out which perspectives on the pandemic produced more or less engagement and which were the characteristics of the accounts that published the content. We followed these procedures: a) we download all posts and profile photos from the available accounts with the help of DownThemAll! plug-in, b) we combine the engagement quality filters and profile class in our Google spreadsheets and create lists with the image files names that meet the criteria, c) we created an application on the mac osx automator using an available Apple script to fetch files from a list, d) using our application we automatically extracted the files from downloaded image repository, e) in image sorter software we grouped the posts and avatars by profile class and engagement quality using the similarity criteria, f) we analysed the images and profile photos manually.
For these analyses we group the profile classes in broader clusters and calculate the engagement quality using the average of engagement of each profile class as indicated in table 1. We excluded “newbies” and “spambots” profile classes, as they were categories with a high level of noisey information and represented less than 3% of the corpus all together (See table 1).
Network Analysis
First of all we used a script to extract all hashtags used in posts including our seed hashtag, using it to compose a table following the model ‘source/target’ in which the post ID is the ‘source’ and each hashtag used is a ‘target’.
This table serves as a base for the composition of network graphs, using Gephi as an interface to applying the Louvain community detection algorithm with three different resolutions: 0.5, 0.7 and 1.0 (lower resolution finds more specific communities and higher finds bigger/generic ones). It enables us to identify macro, meso and micro communities, and choose which one we want to go deep into.
The communities detected are added to our nodes’ Google spreadsheet, also inserted in our main table (involving all metrics related to posts). It allows us to compare different engagement, types of profile and lexical patterns involved in these communities marked by specific combinations of hashtags.
We also use network analysis methods to check lexical analysis using co-occurrence of words (two words before and two words after a given word are connected to this word, composing a different pair of words, considered a network connection if the pair occurs more than twice.) In the resulting lexical network, we use Gephi to identify lexical communities/clusters using resolution 0.5 (only considering in our analysis clusters encompassing more than 5% of the corpus, to avoid not relevant groups).
Lexical Analysis
For the lexical analysis, we used IRaMuTeQ (Interface de R pour les Analyses Multidimensionnelles de Textes et de Questionnaires) created by Pierre Ratinaud (RATINAUD, 2009). IRaMuTeQ serves as an interface for the R language scripts, facilitating thus the structured analysis of textual corpora. Moreover, we primarily used the software to perform Descending Hierarchical Classification (DHC) and Factorial Correspondence Analysis (FCA).
Our corpus consists of two sub-corpora: (i) Instagram posts separated in two large categories based on the calculated posts’ Engagement Rate 2 (ER2), and (ii) Instagram posts separated in the five profile classes that were based on the profiles’ followers. Consequently, on the one hand, we sought to find the language used by posts that had either very high or bad ER2 and, on the other hand, to find each profile class’s vocabulary and compare them one to another.
IRaMuTeQ demands a very meticulous and careful coding of the text before one inputs it for analysis. First, there is a standard procedure that needs to be followed so that the software can recognize the text: we have to divide our text in variables using asterisks (‘**** *Variable’), which is the software’s identification method. Then, we need to make sure that all of our text is in one language, as well as that IRaMuTeQ can recognize words included in these texts (as the software is open-source, we can update its dictionary).
Once we’ve imported our text, we can choose how large we want our Elementary Context Units (ECUs) or Text Segments (TSs) to be; this depends on our variables’ sizes (e.g. for short lines of text, we can have smaller TS). Then, IRAMUTEQ performs a subdivision of the corpus of analysis to reach the text segments TSs, by means of statistical calculations (COSTA, ET AL., 2019). The TSs are divided based on the frequency of the words, which are also lemmatized (i.e., words with common root are grouped together), thus creating separate classes.
As mentioned earlier, in this research we followed a DHC and an FCA. The DCH allows us to obtain TSs that are clustered together due to similarities in their vocabulary but, also, differences from other TSs. To help understand this segmentation, a dendrogram visualization is produced. Moreover, we can further zoom in on our DHC with the FCA, which serves as a plot of the clusters (or classes) to better illustrate similarities and differences.
We then check if these analyses are consistent with the one made using network community detection, described in the previous topic. We also check if the communities identified on the previous step are related to specific and coherent vocabularies. It enabled us to confirm that both our lexical and network analysis parameters are consistent.
Platform grammar’s usage patterns
- a) Grammar usage by profile class
In this section we first explore the general corpus and the initially identified differences among profile classes. Our corpus was composed of 3,929 unique users distributed in 9 profile classes (table). Most of the posts were circulated by seasonal profiles (31%) and Nano Influencer A profiles (30%). Posts made by profiles with more than 5,000 followers represent 23%. The domestic profiles add up to 14% and the newbies and possible bots comprise approximately 3%. We did not see significant variations in the number of posts per user among the different profile classes. As expected, profiles with between 100,000 and 1 million followers have the highest proportion of verified accounts in the corpus. We found that 100% of Mega Celebrities and 41% of Macro influencers have the “verified” badge. Regarding the commercial character of the accounts, the proportions are reversed. We found that 72% of Newbies, 60% of Robots, 49% of seasonal profiles and 46% of domestic profiles are business accounts. In contrast, only 3% of Mega Celebrities and 26% of Micro Influencers are business profiles.
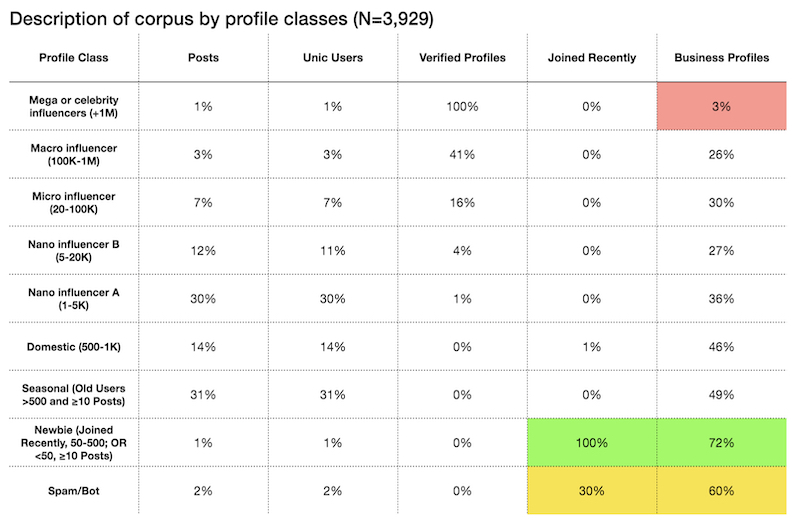
Tab 3. Descriptive index with main data about the profile classes
These initial descriptions show us that the proportion of both business and verified accounts and Instagram joining period vary among profile classes. This may indicate that beyond the differences in number of followers, profile classes can vary both in terms of access to specific metrics (in the case of verified accounts and business accounts) and in terms of experience with the platform’s affordances (account joining period). It is possible that these contrasts among profile classes may also imply different strategies for building and circulating content within Instagram. As a consequence, we need to take into account the “platform’s grammar appropriation practices” involved, otherwise we may lose sight of topics of interest or even make entire groups invisible during the analysis.
Image patterns analysis
- a) Posts Image pattern distributed by engagement quality and profile class overview
In an attempt to map the main visual content circulated under the hashtag #covid19, we explored the post pictures with “very good” and “bad” engagement circulated by the profiles with high and low reach.
The figure below shows the pattern of the “very good” and “bad” engagement post images published by high and low reach profiles. The image can be read as follows: the upper quadrant on the left shows the posts, which were classified as having “good engagement” produced by low reach-profile classes. The upper quadrant on the right shows the posts of “good engagement” made by high reach-profile classes. In the lower left quadrant the “bad engagement” posts produced by low-reach profiles are placed while in the lower right quadrant you find the “ bad engagement” posts produced by the high-reach profiles classes.
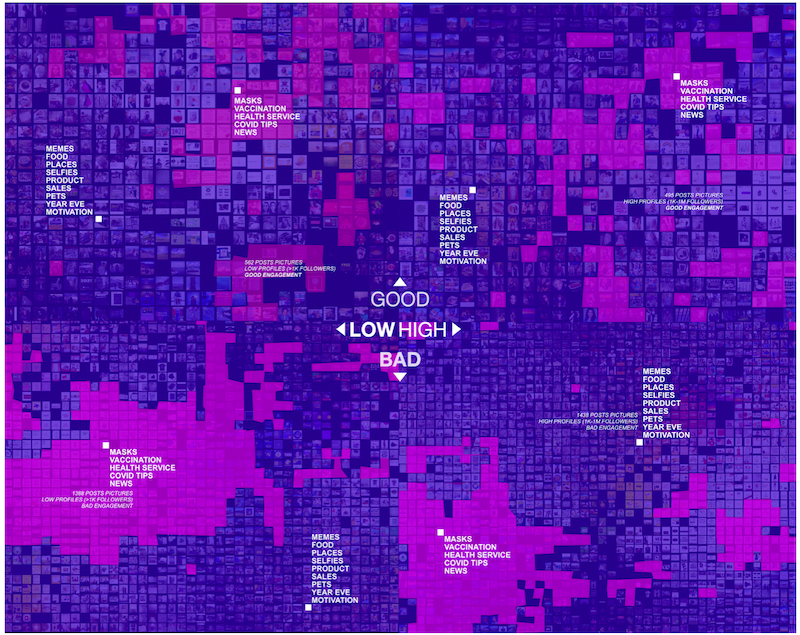
Pic. 3 Image patterns circulated in the posts distributed by quality of engagement and by profile class. The vertical axis separates posts by profile classes. The horizontal axis separates the posts by the quality of the engagement. Images organized by Image Sorter software and modified in Affinity designer. Credit: Elias Bitencourt
The pink blocks represent the post images that are directly related to Covid-19 topics – such as photos of people wearing a mask, being vaccinated, cards with protection tips, advertisements for health services, medical teams and news about the pandemic. Whereas the purple blocks refers to posts images with themes not directly related to Covid-19 – such as photos of pets, food, travel, selfies, memes, motivational cards and celebration messages (Pic. 5).
Most of the images published with the hashtag #covid19 and also associated with other similar hashtags (#covid #COVID19 #covid-19 #corona #coronavirus #pandemic and #pandemia) were not directly related to the health crisis issue. Regardless of the quality of the engagement or the profile reach capacity, the corpus is mainly composed of photographs of food, travel, selfies, products and services, pets, memes, motivational cards and New Year’s Eve messages.
Grouping posts by engagement rate and profile class, we found that posts containing images associated with the pandemic (the Pink blocks) are the minority among the posts with “very good” engagement rate, regardless of whether they were published by low-reach profiles (up to 1k followers) or in high-reach profiles (greater than 1k up to 1M +).
The opposite is true among posts with poor engagement quality. Regardless of the reach power of the authors’ profiles, posts about the pandemic do not seem to stand out compared to random content (the purple blocks). Although there is no great variation in the content-engagement pattern between profiles with greater or lesser reach, it is noted that the number of images directly related to covid topics is proportionally greater among profiles with less than 1k followers.
Although it cannot be conclusively stated, these findings may point to some issues that need further investigation:
- It is possible that the algorithmic changes to Instagram in 2020 have strengthened the platform as a marketplace and this has also promoted the circulation of more business-friendly content. In this scenario, deaths, health issues may not attract sponsors to monetized profiles or consumers to commercial accounts whereas those motivational content, memes, places and lifestyle probably do. In this case, posts with hashtags associated with the pandemic make use of tags’s popularity on Instagram to leverage niche content with more positive perspectives.
- Posts may be taking advantage of #covid19 as a trending hashtag, combining them strategically to boost niche content. So, it might be worth taking hashtags into account by also exploring their situated infotechinical usages and not only by its linguistic meanings as we pointed out in the analysis presented in the following sections.
- The Covid-19 related hashtags usage seems to play an important role in the construction of the imaginary of the pandemic on Instagram. It is likely that the more the posts that associate “Covid” hashtags and hashtags of other topics (such as motivation or lifestyle) receive good engagement, the lower the algorithmic relevance of the posts that use the same hashtags about the Covid-19 with other hashtags more linked to the pandemic itself (such as wearing a mask and measures of social distance). In our case study, for example, #covid19 appears more in posts with positive and stylish messages than as a global crisis with millions of deaths content.
- Using trendiness hashtags as leverage function for ranking algorithms may be an indication that the platform’s technicality is reconfiguring the way users handle information and content on Instagram. When the visibility of the content depends on specific arrangements of platform affordances, the logic used in algorithmic recommendation systems merges with the practices of production and consumption of information on the platform. And this might be reconfiguring not only the content itself but mainly the purpose of the content circulation. In these scenarios, what the content allows one to do becomes more relevant than its ethical, legal or scientific value. However, it is important to keep in mind that since we are dealing with different modes of hashtag appropriation, we can not make big generalizations on this issue. In the network and lexical analysis section we demonstrate that pandemic hashtags are being used both as a boost tool by more influential profile classes and as a “pandemic topic classification” feature by low-reach profiles. Indeed, different usage patterns also produce different engagement outcomes for each hashtag cluster as well.
- b) Profile Image pattern distributed by engagement quality and profile class overview
As in the previous topic, we decided to explore the profile images of the individual posts’ authors. We used the same engagement quality criteria and profile class to group the images. The goal was to identify possible relations among the commercial accounts, the profile classes and the type of content with both greater and lesser engagement.
The image below (Pic.6) can be read as follows: The upper quadrant on the left shows the profile photo of the low-reach accounts whose posts obtained “very good” engagement. The upper quadrant on the right shows the profile photo of the high-reach accounts with posts of good engagement quality. The lower left quadrant shows the avatars of the low-reach accounts whose posts had “bad” engagement and in the lower right quadrant are the avatars of the high-reach accounts whose posts were also classified as having “bad” engagement. The orange blocks represent the profile’s avatars with people and selfies. The blue ones refer to avatars using logos, pets, symbols, objects and characters as a profile identification picture (Pic. 5).
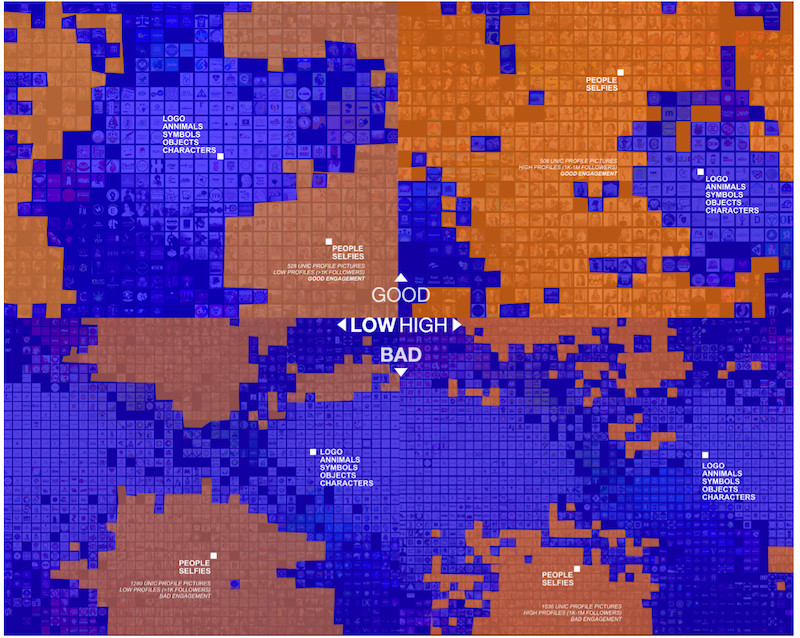
Pic. 4 Image patterns of profile avatars distributed by quality of engagement and by profile class. The vertical axis separates avatars by profile classes. The horizontal axis separates the avatars by the quality of the engagement. Images organized by Image Sorter software and modified in Affinity designer. Credit: Elias Bitencourt
We verified that the posts with the “very good” engagement quality have authors whose profile pictures are predominately pictures of people and selfies. As for posts with a low engagement quality, the preponderance of logos and symbols pictures is greater. This pattern occurs both among the highest-reach profiles (Influencers, between 1k and 1M + followers) and the lower-reach profiles (below 1k followers) as well. However, the number of profiles associated with brands is proportionally higher among the low-reach profiles, whereas the profiles associated with people (on the profile images) have a proportionally greater presence in the influencers’ cluster.
Although not conclusive, these findings may point out some aspects that would be further explored in future analysis:
- The greater presence of profiles associated with people in the posts classified as having “very good” engagement (regardless of the number of followers of the profiles) may indicate that personal profiles would be more likely to generate personalized content and to establish a more personal relationship with the followers, which brings more chances for the so-called “organic engagements” valued by Instagram.
- Companies and brands can gain followers due to seasonal interests or the prominence that a brand may already have in marketing before joining Instagram. This may suggest that brand profiles and personal profiles can not only exercise different regimes of influence and visibility on the network, but also have different ways of platform’s grammar appropriations.
- The fact that there are proportionally more profiles associated with people among the influencers with “very good” engagement rates may suggest that the high-reach profiles also have greater platform grammar literacy. We also see this evidence in the distribution of verified accounts and business accounts within each profile class (Pic.3). These profiles may have more professional, consistent and directed ways of appropriating Instagram’s affordances to achieve greater visibility among their audiences.
- It is possible that the changes to Instagram’s interface and algorithmic prioritisation oriented toward monetization and marketplace features may have attracted more profiles with this commercial appeal aforementioned.
- We used about 15 different Instagram profiles in Phantom Buster to extract data. As these profiles were created a few weeks before the data collection process, they do not have any posts, followers or interaction history. So, it is possible that the “cold-start” logic used in the most recent version of the recommendation algorithm may have valued commercial profiles and sponsored content over regular ones, which ends interfering with the query result.
Hashtag usage patterns by engagement quality over time
Starting with hashtags pattern variations analysis over time, we identified nine recurring thematic groups: Covid / pandemic (query related hashtags group), Years Eave, Motivation, Instagram Vernaculars, News, Medicine / health and Science, fitness and health care. We observed that the hashtags most directly related to the queryed hashtag (#covid19) were the ones that remained most stable throughout the days. This may suggest a possible coordinated use of specific hashtags related to the pandemic and which probably were among the trend topics during the period of data collection.
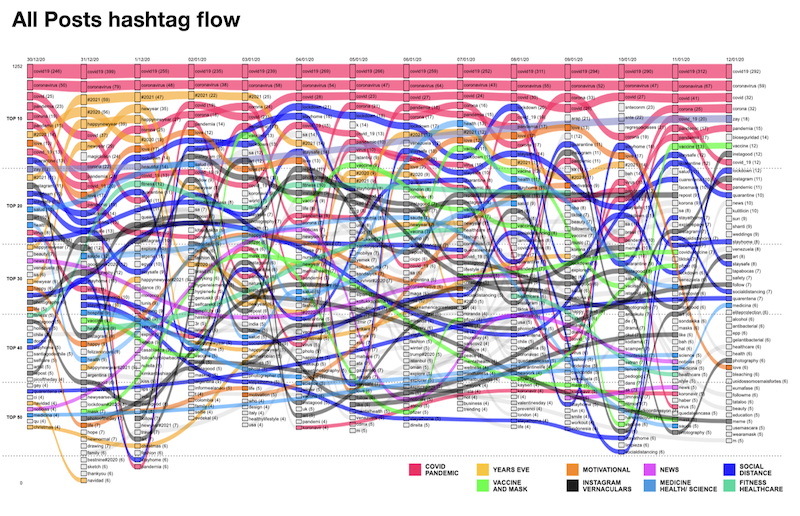
Pic. 5 Top 50 hashtags variations over time. Image generated by the Rank Flow tool (Rieder, 2016) and modified in the Affinity Design Software. Credit: Elias Bitencourt
We then filtered the posts by engagement quality and saw how similar thematic groups could vary in pattern over time. Initially we noticed that the posts with “very good engagement’ generally used less hashtags and were thematically dispersed, whereas the posts with “bad engagement” used more hashtags and also had a more stable use of hashtags from the Covid-19 pandemic theme (see figures below).
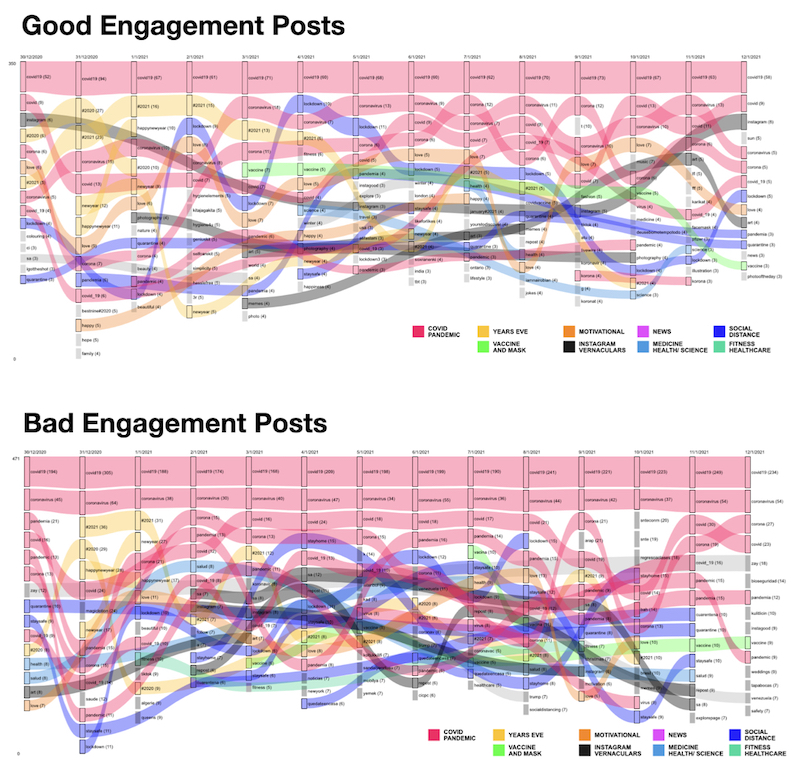
Pic. 6 Top 50 hashtags variations over time. Image generated by the Rank Flow tool (Rieder, 2016) and modified in the Affinity Design Software. Credit: Elias Bitencourt
a) Hashtag usage patterns by engagement quality and profile class overtime
We then decided to separate the posts by profile classes and observe over time variations in hashtags usage patterns in ‘very good’ and ‘bad’ engagement posts. As we said before, the quality of engagement reference used is always proportional to the average engagement of each profile class. During the sprint activities we chose to explore only the following profile classes: Micro Influencers, Nano Influencer B, Seasonal and Domestic. We opted for this strategy because among the profile classes with greater reach, the Micro and Nano Influencers were the ones that had more hashtags in the posts. So, we chose to work with two categories that could represent the profile classes both of greater and lesser reach in our corpus and also provide more consistent hashtag usage data to our analysis.
Profile class hashtag usage patterns in good engagement posts
We found two interesting aspects that deserve further detailed investigations: a) posts with good engagement seem to have a more coordinated and concentrated use of hashtags correlated to query theme – they have a reduced number of hashtags in posts, the hashtags used are the same and apparently vary in synchronized way over the days; b) The great engagement posts containing queryed hashtag (represented by the main pink wave in the flow charts below) fluctuates dynamically over time – there is a greater contrast in the peaks and valleys in #covid19 curve and this variation seems to be also distributed in regular intervals. These two aspects are more evident in the profiles with greater reach (Micro and Nano B Influencers), although they are also present among the Seasonal and Domestic profiles (Pic. 7).
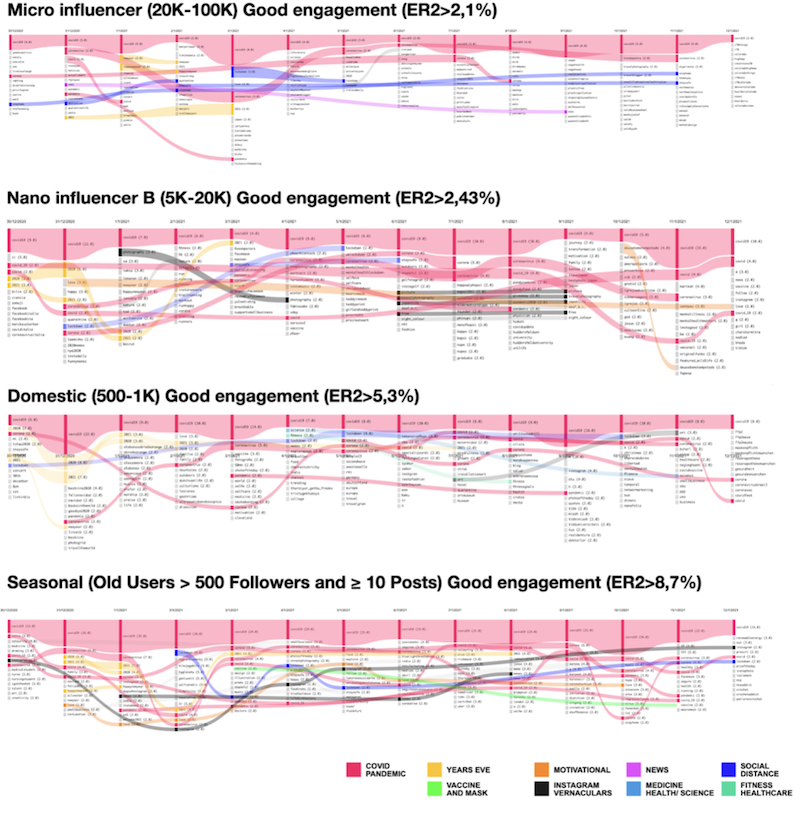
Pic. 7 Top 15 hashtags over time variations in posts with good engagement by profile class. Flow diagram generated by 4Cat (PEETERS; HAGEN, 2018) using the Attribute Frequencies module with the parameters attribute = hashtags timeframe = day top = 15 top-style = per-item. Image modified in the Affinity Design Software. Credit: Elias Bitencourt
We noticed that the posts made by Micro Influencers posts with “very good engagement” demonstrate a more minimalist and coordinated use of pandemic hashtags. Unlike other categories, Micro Influencers basically repeat two hashtags related to the pandemic (coronavirus, corona). These hashtags are used in posts within regular time intervals and when they appear, the posts vary little in terms of quantity. In parallel there is a large number of different hashtags used in combination with these “base hashtags”, that are renewed day after day. Although there are also hashtags related to social isolation and New Years Eve, they either have a short lifespan or appear within very long intervals when appearing in our corpus. This pattern may point to a possible instrumental use of Covid-19 hashtags as a way to take advantage of the hashtag’s popularity to boost diverse content into specific niche audiences. (Pic. 3)
For profiles with an intermediate number of followers (Nano Influencers) we find a similar pattern of pandemic related hashtags. However, in this particular case there is not only an increase in the number of hashtags used in posts but also the emergence of trendy hashtags groups such as Years Eve, Instagram and motivation. The amount of daily hashtag renewing from other thematic groups also remains.
Conversely, the number of posts containing hashtags associated with the pandemic topic drops in the posts of domestic profiles and becomes more intermittent during the days. The volume of other tags renewed per day remains. Therefore, the main difference is that while the Nano Influencers seem to post in a more organized scheme (make a more coordinated combination between top general hashtags and Covid-19 trending hashtags in posts), domestic profiles seem to act in a more dispersed way, which could hint to a less professionalised appropriation of platform grammar and a usage of Instagram coherent with “normal” everyday users.
Among the posts made by seasonal profiles, there is a proliferation of hashtags from diverse thematic groups (such as ‘instagram’, ‘motivation’, ‘vaccine and mask’ and ‘years eve’). These hashtag groups do not have a short lifespan, although they appear intermittently. It is also noteworthy that the number of hashtags associated with the pandemic increases in the posts of seasonal profiles. The number of tags renewed daily, however, also remains.
These findings may suggest that despite the fluctuations and the more dispersed use of tags in seasonal user’s posts, the strategy of combining trending hashtags to boost niche content seems to be present among all profile classes. Additionally, we highlight that among the profile classes with less reach, the seasonal ones concentrate the highest proportion of business accounts (49%). If we add the fact that these commercial accounts and high-reach profile classes may have access to more rich platform metrics and more insightful data guidance, it is possible that the strategy of leveraging niche content through the appropriation of hashtags are likely to occur differently depending on profile classes.
Hence, different profile classes can reveal diverse cultures of use, and alternative modes of grammar appropriations, interfering not only in terms of content interests (which is already widely known) but also creating different content regimes of visibility that may compete for algorithmic “attention” on the platform. If different cultures of use may result in alternative visibility regimes, then mapping vernacular practices in platform studies should be understood as a methodological step prior to content analysis and content circulation analysis of networks.
Profile class hashtag usage patterns in bad engagement posts
We did the same type of analysis for posts with “bad engagement” and noticed a contrast in relation to the same aspects previously observed in “good engagement” posts: a) An increase of pandemic hashtags used, their dispersed and poorly coordinated fluctuations over time – the rise of different hashtags used on the same topic and their randomly variation throughout the days, b) there is little variation in the number of daily posts with bad engagement using the queryed hashtag (#covid19) – graphs show that there is little dynamics in the main hashtag curve and when these variations occur, the intervals are larger than those observed in the post with “very good engagement” (Pic. 8).
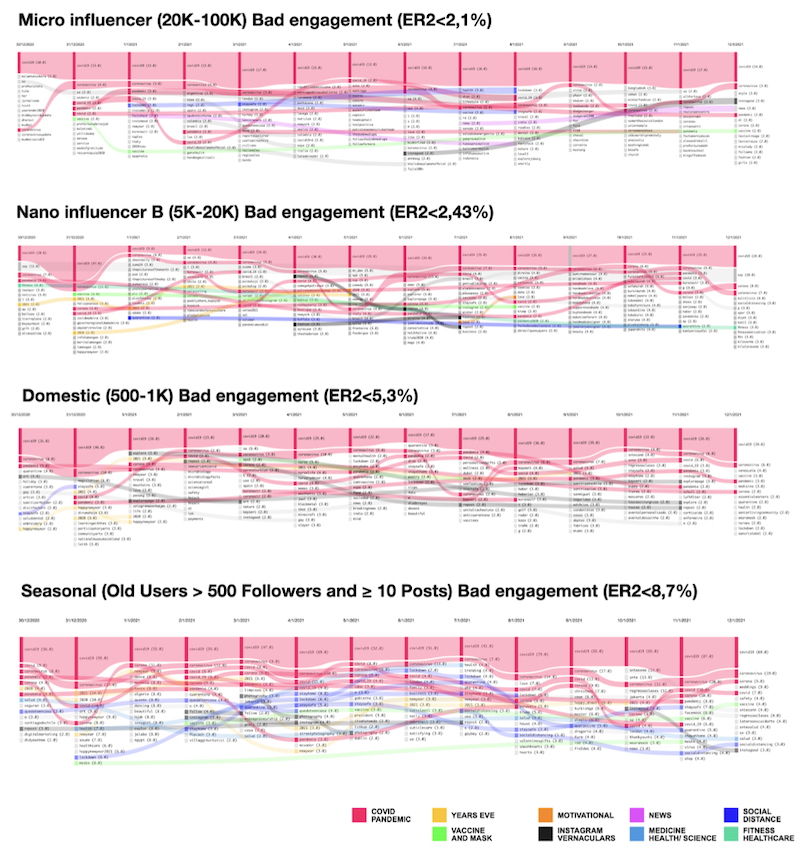
Pic. 8 Top 15 hashtags over time variations in posts with bad engagement by profile class. Flow diagram generated by 4Cat (PEETERS; HAGEN, 2018) using the Attribute Frequencies module with the parameters attribute = hashtags timeframe = day top = 15 top-style = per-item. Image modified in the Affinity Design Software. Credit: Elias Bitencourt
Although these analyses are still in progress, these findings may point out that the more consistent but also dynamic hashtag usage patterns are adapted to the new parameters of Instagram’s recommendation algorithms. At the end of December, Instagram reported that content recency now plays an even more important role in the rules of its algorithmic recommendation systems. This dynamic posting behavior of using popular pandemic hashtags combined with other niche hashtags with a high degree of daily renewal can bring qualities of ‘novelty’ and ‘trend’ to tags that are overused, leveraging the content within niches on the platform. On the other hand, more stable posting behavior of using popular pandemic hashtags associated with a dispersed use of many other hashtags on the same subject topic, may be algorithmically classified as a lack of originality or “newness”, a thematic saturation pattern which could lead to less visibility of these posts within the niches.
These findings are important because they show us that posting practices using Covid-19 hashtags as a boost strategy may be obfuscating the pandemic content under the pandemic’s hashtag vocabulary on Instagram. Our analysis shows that the combined use of at least two or three hashtags related to the topic of Covid-19 is more frequent in posts with good engagement but that do not talk about pandemic contents itself.
Therefore, constantly using pandemic tags as content boost strategy in conjunction with other niche hashtags may affect the “pandemic” meaning of Covid-19 related tags. Hence, this kind of vernacular practice may broadley reframe Covid-19 vocabulary and imaginary on Instagram. Even though there are other forms of hashtag appropriation (as a topic classification tool, for example), it is possible that using hashtags as a niche content boost tool may have interfered in the interaction among hashtags (which could be analysed considering the network of interconnected hashtags) since there were high-reach profiles related practice on the network. We’ll cover this briefly in the next section.
Put simply, the imaginary of Covid-19 on Instagram is shaped not only by the ranking algorithm systems themselves, but by the entangled relationship between algorithms and platform grammar appropriation cultures. In our case study, Covid-19 hashtags become an engine to boost engagement rather than amplify the pandemic debate on Instagram. This vernacular mode of hashtags usage is rather focused on promoting a subtopic (e.g. arts, beauty and lifestyle) than circulate content regarding pandemic humanitarian crisis.
This poses a problem. When a pandemic hashtag is used as a leverage feature, Covid-19 as a theme becomes diluted in the network and starts to compete with diverse niche topics that were associated with pandemic tags. This produces a Covid-19 Instagram imaginary that has the pandemic as a means to promote diverse contents, but not necessarily the pandemic as a thematic issue in itself.
Identifying how similar hashtags are appropriated in different ways can provide important clues for co-hashtag network analysis. That is, mapping hashtag usage practices by different profile classes can help to highlight the platform vernaculars that may characterize each hashtag cluster providing important insights to better understanding different regimes of visibility and content circulation in dispute on the network. This is important because it sheds light into three methodological issues a) the need of combined use of digital methods in Instagram grammars and practices studies, b) the importance of treating Instagram grammars not only by its linguistic dimensions, but also taking into account its technicalities and their different forms of appropriations by the groups on each network explored, c) the importance of mapping platform vernacular practices – and its particular modes of platform’s grammar appropriation – before interpreting content circulation dynamics on Instagram network.
Network Analysis
- a) hashtag network clusters, their posts and communities
As shown in the previous topics, hashtags can be used by different profile types looking for boosting their niches’ content, even when it is not directly related Covid-19. If all eyes are turned to the pandemic, using it starts being part of diverse groups’ visibility strategy. The relation between posts and hashtags can be analysed as a network. If these profiles follow patterns when combining diverse hashtags, the connections made by these patterns over time can build up clusters connecting profiles, posts and groups of hashtags. Any pattern involving specific profile types would make itself visible as a cluster/community in the final network of hashtags, even if the hashtags’ topics are apparently disconnected. It is a way to turn the combinations of hashtags into a structure with maps, junctions and disjunctions, centers and periphery, big clusters and lonely small groups, trying to guide users’ visibility. Do the network of hashtags’ structure and clusters aligns with the strategies concerning the use of hashtags according to profile types identified in the previous topics?
In our bipartite network of posts and hashtags, we focus on the five communities (clusters) encompassing more than 3% of all network nodes using Louvain algorithm’s resolution 1.0. They concentrate 19,8% of the network in its core, indicating the existence of main clusters encompassing one in each five posts/hashtags in our sample. The frame below illustrates our network of hashtags and posts, presenting five different communities and its relations with post metrics, profile classes and engagement quality. It is useful to understand if the structural communities identified through our network analysis are correlated to differences in engagement or specific perspectives on Covid19 (Pic. 9).
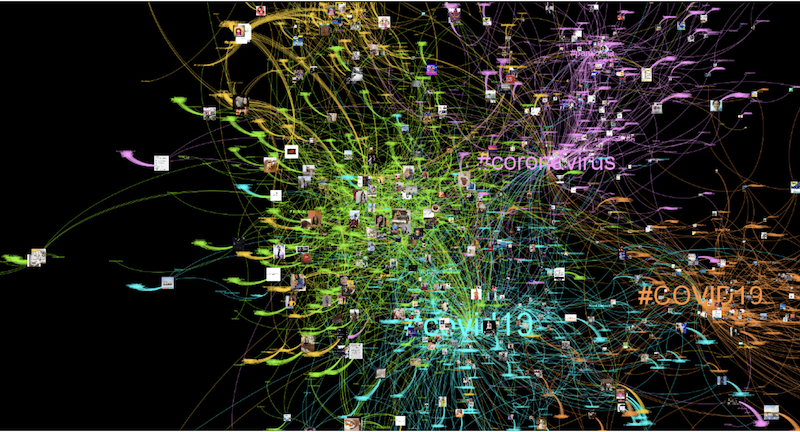
Pic. 9 T Network of hashtags and posts. The five colors highlight the different communities and its relations with engagement metrics and profile classes. Image generated by Gephi. Credit: Luis Junqueira
- b) Differences in subject topics and profile classes presence in network clusters
Though the textual and lexical analysis are made using other tools in the following topics, it is interesting to notice how hashtags indicate topics being used to bring visibility to these clusters. The hashtags of posts in each community (clusters) compose coherent groups, exception being the Green and Yellow . These exceptions are marked by the so called ‘Instagram vernaculars” groups of hashtags used when appropriating from covid to boost visibility, not dialoguing with the topic. It is worth mentioning that other clusters also use #covid19 as a way to leverage their visibility, despite the apparent coherence among hashtags used. Remembering that the id corresponding to each color is as follows: Blue, Orange, Green , Pink and Yellow.
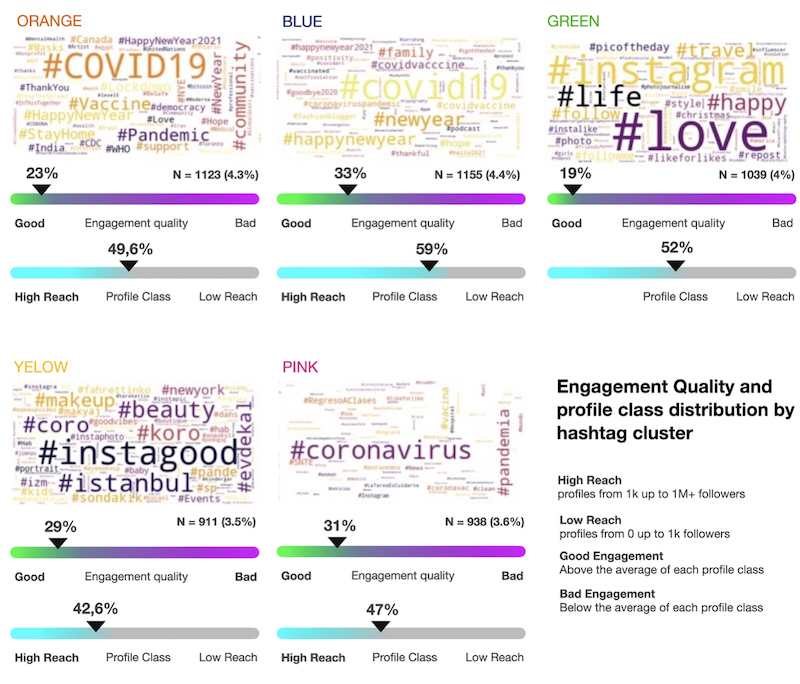
Pic. 10 Engagement quality and profile class distribution by hashtag clusters. Profile classes were aggregated into two groups: low reach (from 0 up t to 1k followers) and high reach (from 1k up to 1M+ followers). Wordcloud generated using Python. Visualization created in Affinity Designer. Credit: Elias Bitencourt and Luis Junqueira
While communities Green and Yellow associate Covid-19 with unrelated topics involving ‘good vibes’ and ‘happiness’, what points to possible use of health issue to gain visibility and promote contents, the Pink community is marked by topics like suspended classes, vaccine and coronavac, without this intrusion, and the Blue and Orange brings topics directly related to covid mixed with expectations about new year/family associated with quarantine/lockdown. Though it indicates connections and general topics we could expect, any analysis in this sense needs to go beyond hashtags and take into account the practices’ vernacular analysed in previous topics and the vocabularies of these posts analysed in topics below.
It is interesting that new year hashtags appear in diverse clusters, pointing out the relevance of this topic inside covid discussion (either because of the end of 2020, the possibility of not uniting the family due to restrictions and related topics) beyond the use of #covid19 to boost visibility. As shown in our over time comparisons, this is a seasonal topic with a short lifespan, though recurrent in a specific period. It does not affect the connections made by the use of this hashtag, showing how it appears in different clusters. It is also interesting to note that there is a coherent cluster concentrating ‘Instagood’ topics, meaning that these hashtags are used recurrently by a group appropriating from covid, but not randomly associated with diverse disparate topics. In the latter case, though not necessarily related to covid, further research could show if this is a thematic niche strategy (different from non-thematic groups strategically using #covid19 to gain visibility).
Hashtag network characteristics by profile classes.
The distribution of profile classes sheds light into a slight concentration of different kinds of influencers on specific clusters of hashtags, while Domestic users are more equally distributed among them.
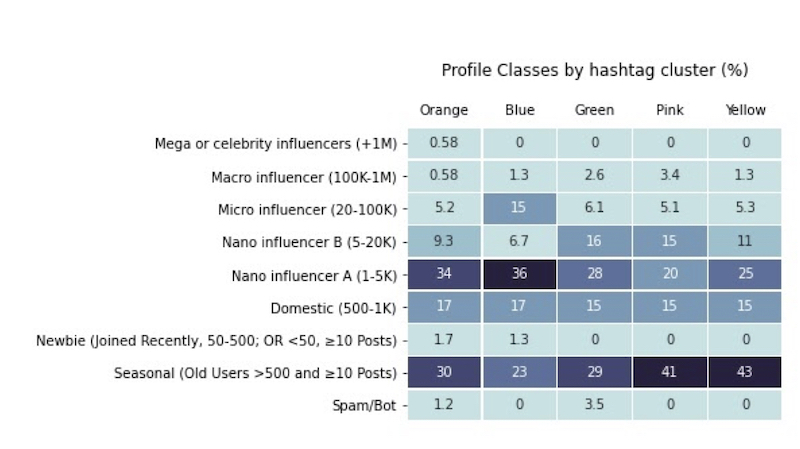
Pic. 11 Profile classes distribution within hashtag clusters.
Though we could notice the concentration of some kind of profiles in specific clusters, the type of profiles does not appear to be a defining feature in determining the belonging to a cluster. Rather, profiles from similar classes can belong to different clusters according to their strategies. Given the segmented character of Instagram audience, we can expect influencers focused on different publics to appropriate from COVID discussion promoting different topics.
For example, the Pink clusters talking more specifically about health related topics concentrates Macro influencers, but the second higher rate of Macro influencers can be found in Green (good vibes) cluster, indicating the distribution of different influencers among diverse topics using Covid-19 hashtags. Pink also brings a great deal of Seasonal profiles talking about the pandemic, but this type of profile is also highly visible in the Yellow (mixed topics) community. On the one hand, the fact that profiles are seasonal can help us understanding why the topics are not homogeneous and seem disconnected, confirming the proliferation of hashtags from diverse thematic groups mentioned in previous topics; on the other hand, there are also Seasonal users restricting their use of hashtags to covid related health issues (Pic. 9).
Further analysis will explore the proportion of different profile classes throughout the network structure and how their practices impact directly the network design and pathways.
Hashtag network characteristics by ER2 quality.
It is important to remember that the distribution of engagement presents concentration in few posts with high engagement on Instagram while most posts have low engagement. The measure of success relies on the proportion of high engagement rate, but the tendency is that all clusters present more negative engagement rates than positive. In the analysis of practices we have seen that influencers with greater impact use fewer hashtags, which could result in an underrepresentation of this profile in the clusters of hashtags.
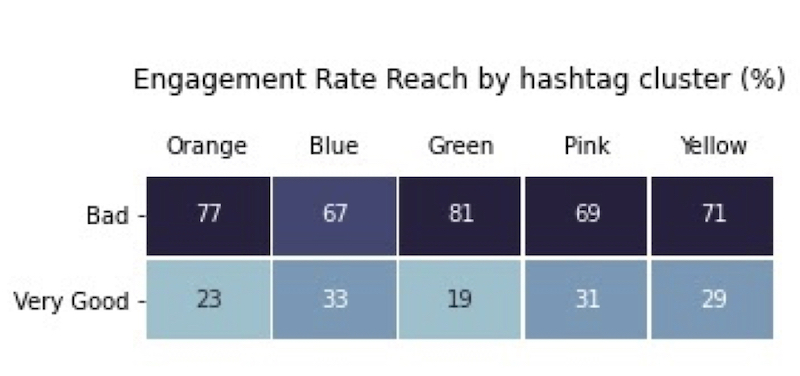
Pic. 12 Engagement quality distribution within hashtag clusters.
The clusters that have a higher proportion of posts with good engagement are Blue (which uses predominantly year-end hashtags) and Pink (which seems to use hashtags about vaccines, back to school and social isolation). In this case, the Blue cluster concentrates 59% of influencers’ profiles while the Pink cluster has 58% of low reach profiles, which may justify the more dispersed character of the hashtags. Therefore, the analysis of hashtag networks reinforces what we found in the analysis of practices: by the distribution of the cluster’s engagement and profiles, perhaps what we have here is an example that different practices generate similar results in different audiences (Pic 10).
Lexical analysis
As mentioned earlier, we use IRaMuTeQ interface to perform Descending Hierarchical Classification (DHC) and Factorial Correspondence Analysis (FCA). For this research, we defined 30 words as the Elementary Context Units (ECUs) size, which gave us 9.937 Text Segments (TSs).
We then did the DHC, which separated the corpus in four clusters: the first cluster accounted for 12% of the corpus, the second cluster for the 9.3%, the third cluster for the 37.5%, and the fourth cluster for the 41.2%. Additionally, 90.11% of the total corpus was clustered (8.954 out of 9.937 TSs), which makes the clusters extremely representative of the overall discussion associated with our query hashtag on Instagram (see Figure below).
- a) Differences in the vocabularies among different profile classes.
I. Descending Hierarchical Classification
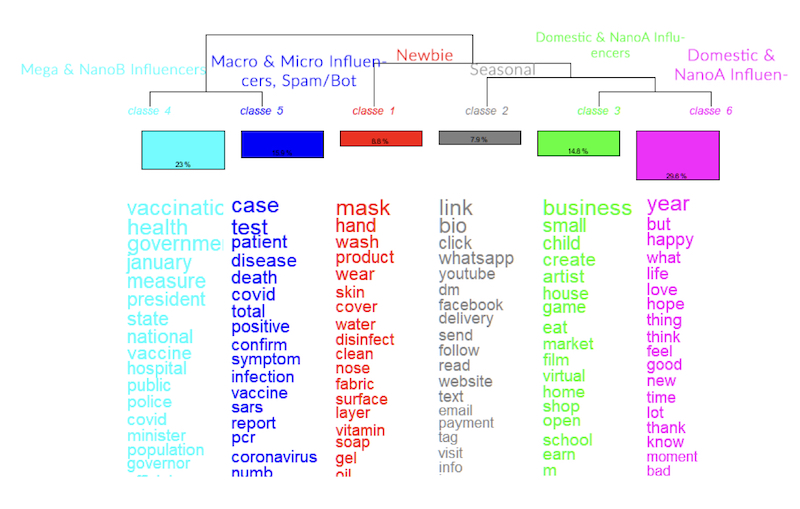
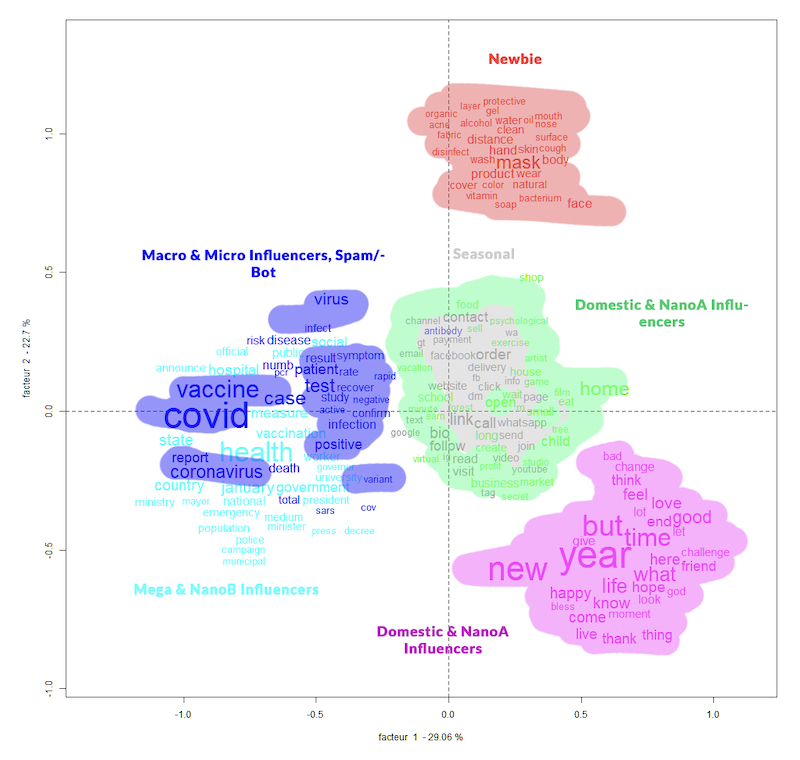
Pic. 13 Lexical analysis vocabulary clusters by profile classes Credit: Charis Papaevangelou
The twin vocabularies involving governmental measures on public health (classe 4) and ‘new cases’ ‘testing positive’ (classe 5) on the left side of the dendrogram contrasts with the business, market, schools (classe 3) and happy, love, new year (classe 6) on the other. This seems to be the main thematic division structuring the discussion on Instagram, with two sub vocabularies in the middle: a vocabulary around masks and products related to domestic measures against covid (classe 1) and other calling people for online engagement with content and shopping (classe 2). Classes 4 and 6 concentrate, respectively, 23% and 29,8% of the entire corpus analysed.
The largest cluster of our Descending Hierarchical Classification analysis, that makes up for almost 30% of the whole corpus, is the 6th one (Pink), that seems to relate more to the Domestic and NanoA Influencers. In this cluster, we see a rather positive image and vibes being promoted, which is juxtaposed to the grim nature of the pandemic, as was also mentioned in the “Post’s image analysis”. As noted in the Chart Flow analysis and confirmed here, the smaller profiles (newbies, seasonal, domestic) are correlated and clustered closer together compared to the other classes, while the NanoA class seems to occupy the middle space between them and the larger profiles.
The Celebrity/mega class profiles used the most different language compared to the rest of the profile classes, and their posts mostly referred to vaccines, news reports and governmental policies concerning the pandemic. Remembering that it does not mean that the content with higher engagement among all posts of this kind of profiles refer to these topics (even influencers face diverse levels of success in their posts), but that the overall vocabulary is characterized by them.
Macro, Newbies and Spam/Bot classes also diverge from the rest of the corpus, somewhat confirming the observation made through the Flow Chart analysis of how the medium-sized profiles have more or less consolidated a specific platform grammar, whereas larger and smaller ones diverge for different reasons.
Moreover, it seems that the smaller profiles (newbies, seasonal, domestic) are correlated and clustered closer together compared to the other classes, while the NanoA profile class seems to occupy the middle space between them and the larger profiles, acting as a transitional space.
Thanks to the nuance provided by the DHC analysis, we can observe that Seasonal (Grey) influencers do promote a self-entrepreneurial approach. It involves call-to-action messages, links and information about other networks and sites, indicating activities that could involve cross-platform initiatives. The fact that their appearance on Instagram seems to be seasonal can be related to this call for other platforms.
The DHC brought really interesting insights for further research on the relation among the diverse vocabularies related to discussions about the pandemic and others related to Instagram vernacular, perpassing different types of profiles analysed.
II. Factorial Correspondence Analysis
To better understand how far or close the profiles are, considering vocabularies as a measure of proximity, we used a Factorial Correspondence Analysis (FCA). Using FCA to plot our lexical clusters and profile classes, we noticed that the Domestic, NanoA and Seasonal profile classes have highly interconnected vocabularies. In our plot, the first two almost encapsulate the third, like showing how to achieve what we’ve labelled as relevant vocabularies.
Pic. 14 Factorial Correspondence Analysis by profile classes. Credit: Charis Papaevangelou
Interestingly, the 3rd class (Green-Domestic and Nano A profiles) and the 2nd class (Grey-Seasonal) are highly interconnected; the former almost encapsulates the latter, like showing the latter effort to use vocabularies and practices more willing to bring engagement. Just by going through the most important words, listed in the DHC graph above, we can clearly see the “marketplace turn” of Instagram, as noted previously.
Note that the 3rd cluster (Green) is not represented in the FCA plot, probably due to it not having a strong correlation with a single profile class. However, after zooming in, we can infer that it relates to the three classes mentioned in the picture.
Considering 20 most frequent words in each profile class, Spam/Bot, Mega, Macro and, slightly, Newbie, diverge from the rest of the clusters, where words like “covid” and “year” dominate. In Mega we see words related to health but, also, words related to the development of the pandemic, like “vaccine” or “child” (a typical text segment contained the news about child care workers being the next group to be vaccinated). In Macro, while thematically the words here are really similar to the Mega class, it’s clear that they came from news outlets or are meant to inform the public (we can see the word “amp”, that stands for Accelerated Mobile Page and is predominantly used by news outlets to make their web pages faster accessible). When it comes to Newbie, though we don’t have a thematic coherence, we can argue that the vocabularies employed by influencers in this class is centred around a self-entrepreneurial approach, trying to sell or promote hygiene products. Spam/Bot also bring words referring to health and dealing with the pandemic.
Considering the two ER2 quality clusters (Bad and Very Good ER2), we also look at the typical text segments (TSs) scores, in which the highest scoring TSs according to the Correspondence Analysis is associated with greater density of the TS within a cluster). We see that:
- The highest scoring TSs for the Bad ER2 posts contain laconic news regarding the pandemic alongside a high amount of numbers (e.g., new number of cases). Also, this would mean that posts containing many numbers without a coherent textual structure are not favoured in terms of engagement.
- The highest scoring TSs for the Very Good ER2 posts contain developments on the front of fighting the pandemic (e.g., news about vaccines).
- Moreover, by cross-comparing them to the Profile Classes, we can identify that the small to medium-sized profile classes (from Seasonal to Nano A) are prevalent in both ER2 categories. In other words, the small to medium-sized profiles seem to employ a similarly patterned platform grammar with dense wording, in juxtaposition to the larger and, perhaps, really small ones, that seem to employ a rather unique or distinguishable platform grammar.
The good engagement involving news about vaccines and the bad involving cold numbers can shed light into variations inside frames regarding pandemic and their impact on engagement. Also, the efforts to sell products and the difference between this vocabulary and all other vocabularies discussing covid points out to diverse interests and actors disputing our query hashtag.
- b) Word co-occurrence network and lexical communities structure
To check for possible flaws involving STs and texts not included in clusters made in the previous topic, we rely on a lexical network involving all pairs of words that appear recurrently in our corpus.
Considering all posts (and not just the main clusters identified in our bipartite hashtags network), we used WORDij to compose a lexical network, using Lovain Community detection algorithm (resolution 0.5) to find lexical communities. We only consider clusters encompassing more than 5% of the corpus in our analysis. From 5,553 words composing the co-occurrence network, 47% are interconnected in the main component (2.622 words). The seven clusters encompass 69.8% of the words in this network, distributed as follows: Purple (23.5%), Light Green (10.1%), Orange (8.7%), Purple2 (8.4%), Dark Green (7.1%), Brown (6.8%) and Pink (5.3%).
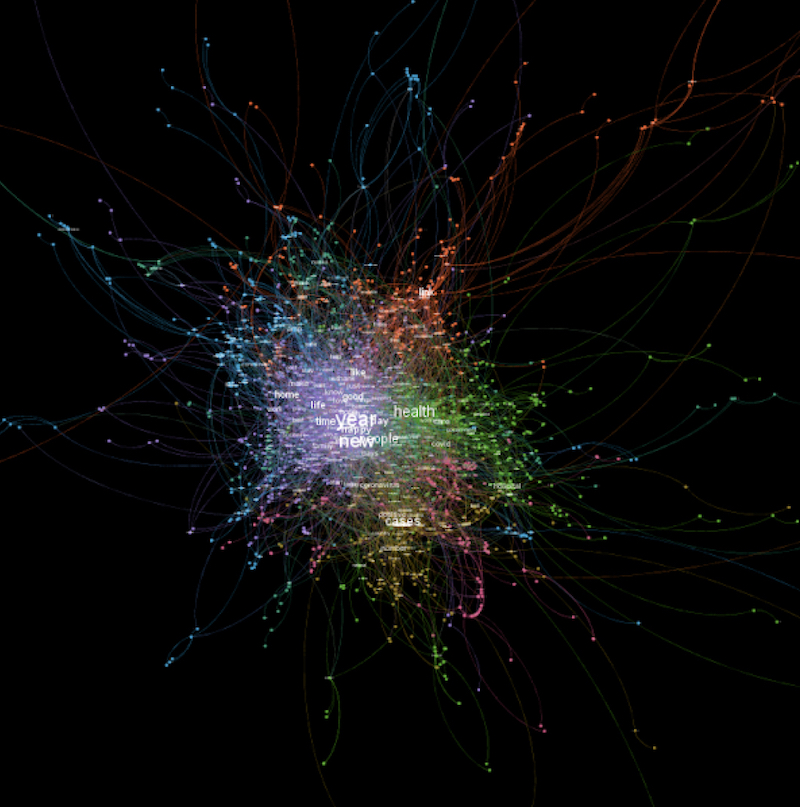
Pic. 16 Word co-occurrence network and lexical communities structure. Colors depict seven different communities. Image generated by Gephi. Credit: Luis Junqueira
Communities related to Purple (23.5% of all words in the corpus) and Pink (5.6%) in our lexical network seem to correspond to vocabularies found in the two main clusters of our Hashtags network, the hashtags clusters Blue and Orange respectively. However, due to the consideration of all texts in the corpus regardless of their connections with profile classes or major hashtag clusters, this network also brings topics of discussion not contemplated to the previous ones (given its lack of connections with main hashtags clusters analysed above or specific vocabularies of profile classes). This is useful to identify topics outside our scope and consider their relevance for the discussion. In this case, the novelty is related to more information about engagement and call-to-action grammars involving ‘link’, ‘bios’, ‘amp’ (Accelerated Mobile Page) and terms related to Instagram practices but not necessarily Covid-19 discussion’s vocabularies. It does not brought information that could foster revisions on our previous analyses.
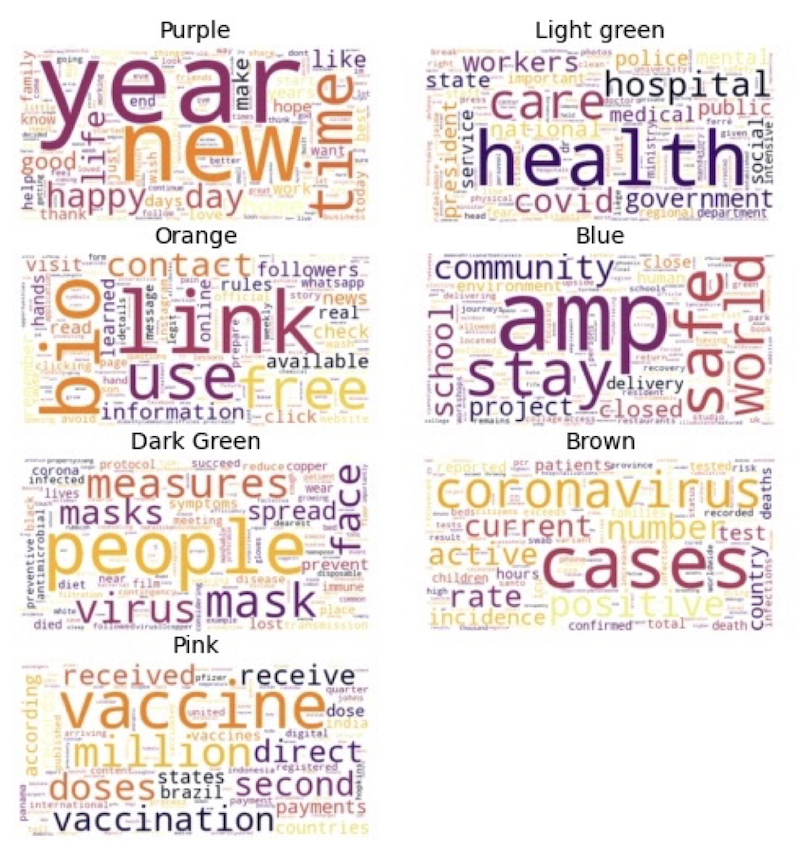
Pic. 17 Communities word clouds. Image generated in python. Credit: Luís Junqueira
In exploring the use of hashtags, imagery and their effect in gaining engagement, we used image analysis to obtain an overview of the general trends in post and user profiles. The image analysis functioned as a way to initially explore the data, giving insights into how brand profiles, news outlets and individual user profiles were all shaping the Covid-19 imaginary, illustrating promotional and informative dimensions of this imaginary.
Following the image analysis, we explored the usage of hashtags by different user profiles using the Rank Flow tool (Rieder, 2016). What became the most interesting overarching finding was that the imaginary of Covid-19 was highly segregated into smaller ‘sub-conversations’ that often did not have a clear relation to the health pandemic situation. This we based on the fact that the #covid19 is used as a tool to promote visibility of various agendas (e.g. arts, fitness, beauty, food etc.), so the covid theme is diluted, gains new appropriations of meaning and becomes invisible as a public health issue. Based on the analysis over time, we identified how the high performings posts were able ‘ride the wave’ of the #Covid-19 without using other related hashtags, whereas the low performing posts used multiple pandemic related hashtags, also illustrating how there was a general trend of “less is more” about the amount of hashtags and better engagement.
In understanding these patterns of hashtag usages we also explored how literacy and platform mechanisms were part of forming these practices. In comparing different profile classes, and their hashtags usage patterns, we identified disparate modes of affordances use by the most far-reaching profiles (Mega influencers), the profiles that seek professional visibility (influencers) and domestic users. Smaller profiles seem to take as a reference the visibility practices that are more anchored in common sense about social media marketing (combining popular hashtags in posts, for example) and are no longer in use by profiles with greater reach in the network (the posts with the best engagement from mega celebrities and Macro influencers didn’t even have hashtags in the caption).
These contrasts in platform’s grammar usage practices among profile classes seem to reflect discrepancies among users types, concerning how ‘effective’ professional practices to increase visibility on Instagram are perceived and actually performed. This can open further research paths to understand if and how users in smaller categories reproducing practices ‘perceived as influencing’ (larger number of #specific platform vernaculars, “acting as influencer” visual narratives), but with lower efficiency on Instagram, are supporting self-reinforcing mechanisms of hierarchization of power-visibility and standardization of content creation to ‘fit in’ perceived algorithmical visibility criteria.
Due to the recent change in Instagram’s algorithm (Autumn 2020) we were also able to see how this affected the imagery in specific ways. Here we could identify that the algorithmic change afforded higher visibility to recent and original posts (originality meaning unique combinations of hashtags), which was part of enabling the specific shaping described above. Equally, we propose that users with strong platform literacy (such as Mega celebrities, Macro and Micro influencers) might have been faster at noticing and incorporating these changes into their strategies, enhancing this effect further and potentially skew the Covid-19 imaginary towards the more professional users’ way of presenting the topic. It illustrates how algorithmic literacy continues to be an important aspect to explore to understand who has ‘power’ in a datafied and platformised society by being able to use these infrastructures to their benefit and become powerful actors in processes of issuefication.
Using lexical analysis, we were able to map five different perspectives appropriating from Covid-19 throughout the posts, ranging from governmental issues concerning the pandemic (classe 4), news on testing and pandemic growth (classe 5), market and schools related topics affected (classe 3), masks and domestic measures of protection (classe 1), the calling for online engagement with content and shopping (classe 2) and finally the ‘instagood’, love and new year perspective (classe 6). The classes 4 and 6 concentrate the discussion, showing the division between health debate and more positive pics that characterizes stereotypes about Instagood topics (Pic 11). This division is also related to different profile classes, the domestic users being closer to instagood and mega influencers closer to the health debate, while other profile classes are related to market around the pandemic.
By looking at the two ER2 quality clusters (Bad and Very Good ER2) we identified that the most prevalent text segments of the Bad engagement (ER2) posts contain tiny news segments regarding the pandemic alongside a high amount of numbers (e.g., new number of cases). We argue that this could mean that posts containing many numbers without a coherent textual structure are not favoured in terms of engagement. Also, some of the most characteristic text segments of Very Good ER2 posts contain developments on the front of fighting the pandemic (e.g., news about vaccines). It reinforces the idea of Covid-19 as a way to boost visibility, but sheds light into specific uses related to this visibility. Last, by cross-comparing ER2 posts to the Profile Classes, we can identify that the small to medium-sized profile classes (from Seasonal to NanoA) prevail in both ER2 categories. In other words, the small to medium-sized profiles seem to employ a similarly patterned platform grammar with dense wording, in juxtaposition to the larger and, perhaps, miniscule profiles, that seem to employ a rather unique or distinguishable platform grammar.
Beyond the questions posed by covid19’s hashtag, we also try to solve methodological problems: How do we know that the adjustments used are the best for the research in question, and that the division identified in the network actually involves different communities? By identifying the different vocabularies present in the network, how can we associate this difference with the connections and network metrics involved in the visibility dynamics? Understanding the relationship between metrics, hashtag usage, and profile classes, how do we associate these findings with the way these same hashtags compose networks in which similar engagement metrics are identified in different positions inside network structure? The answer is, necessarily, through a mixed methods approach, going beyond the results of each method considered isolatedly.
Our mixed methods approach is the aim to improve digital methods used in our field through mutual validation of independent methods of analysis. The results of research algorithms cannot be accepted as natural: on the one hand, it is possible to obtain different clustering results according to the adjustments operated in the algorithms and, in the other hand, it is possible to generate diverse images using the same metrics as a basis. But, if communities identified through our network analysis (considering cooccurrence of hashtags) are consistent with lexical clusters identified in our lexical analysis (considering texts involved) we can be sure that our network analysis algorithms are adjusted correctly, for example.
Further data exploration can enrich our first impressions about a possible correlation between thematic differences and topic life-span, with different professional levels of usage, considering Instagram’s changes prioritizing recency and originality which afford visibility to some posts over others, particularly those combining few popular hashtags with original limitedly occurring hashtags. Future analysis may explore this in relation to professionalization strategies and compare the appropriation of these trends by profiles classes (including Celebrities, Macro influencers and seasonal users) with different propensity to commercial exploitation of their Instagram visibility/seasonal and ‘general’ users.
This analysis illustrates that we must continue to understand and investigate the meaning of hashtags as the result of a dispute between its function as a platform tool (making content searchable and classifiable), as a vernacular of the platform (lexical practices and appropriations that derive from the culture of use) and the sociotechnical arrangements it produces (number of publications associated, quality of engagement of these publications and relationship with other frequently associated hashtags).
Arriagada, A., & Ibáñez, F. (2020). “You Need At Least One Picture Daily, if Not, You’re Dead”: Content Creators and Platform Evolution in the Social Media Ecology. Social Media and Society, 6(3). https://doi.org/10.1177/2056305120944624
Bitencourt, E. C. (2019). Os Livros intermitentes: Um ensaio sobre as materialidades da representação algorítmica do livro na plataforma de autopublicação da Amazon. In C. Porto & E. Santos (Eds.), O Livro na Cibercultura. Editora Universitária Leopoldianum. https://www.unisantos.br/wp-content/uploads/2019/11/Cibercultura.pdf
Bitencourt, E. C. (2021). Smartbody: Plataformas digitais, tecnologias vestíveis e corpos remodelados. Fafich/Selo PPGCOM/UFMG (Forthcoming).
Bucher, T. (2012). Want to be on the top? Algorithmic power and the threat of invisibility on Facebook. New Media & Society, 1164–1180. https://doi.org/10.1177/1461444812440159
Bucher, T. (2017a). The algorithmic imaginary: exploring the ordinary affects of Facebook algorithms. Information Communication and Society, 20(1), 30–44. https://doi.org/10.1080/1369118X.2016.1154086
Bucher, T. (2017b). The algorithmic imaginary: exploring the ordinary affects of Facebook algorithms. Information Communication and Society, 20(1), 30–44. https://doi.org/10.1080/1369118X.2016.1154086
Bucher, T. (2018). If…Then Algorithimic Power and Politics (Issue 6). Oxford University Press.
d’Andréa, C. F. de B. (2020). Pesquisando Plataformas Online (LAB404/UFBA (ed.)). Edufba. https://repositorio.ufba.br/ri/handle/ri/32043
Dieter, M., Gerlitz, C., Helmond, A., Tkacz, N., van der Vlist, F. N., & Weltevrede, E. (2019). Multi-Situated App Studies: Methods and Propositions. Social Media + Society, 5(2), 205630511984648. https://doi.org/10.1177/2056305119846486
Geboers, M. A., & Van De Wiele, C. T. (2020). Regimes of visibility and the affective affordances of Twitter. International Journal of Cultural Studies, 23(5), 745–765. https://doi.org/10.1177/1367877920923676
Geboers, M., Stolero, N., Scuttari, A., & Vliet, L. V. A. N. (2020). Why Buttons Matter: Repurposing Facebook’s Reactions for Analysis of the Social Visual. International Journal of Communication, 14(0), 22.
Gerlitz, C., & Rieder, B. (2018). Tweets are not created equal: Investigating Twitter’s client ecosystem.International Journal of Communication, 12, 528–547.
Gibbs, M., Meese, J., Arnold, M., Nansen, B., & Carter, M. (2015). #Funeral and Instagram: death, social media, and platform vernacular. Information Communication and Society, 18(3), 255–268. https://doi.org/10.1080/1369118X.2014.987152
Gillespie, T. (2016). What Is a Flag For ? Social Media Reporting Tools and the Vocabulary of What is a flag for ? Social media reporting tools and the vocabulary of complaint. New Media & Society. https://doi.org/10.1177/1461444814543163
Gillespie, T. (2018). Custodians Of The Internet. Yale University Press.
Hallinan, B., & Striphas, T. (2016). Recommended for you: The Netflix Prize and the production of algorithmic culture. New Media and Society, 18(1), 117–137. https://doi.org/10.1177/1461444814538646
Latour, B. (2013). An Inquiry Into Modes of Existence. An Anthropology of the Moderns (1st ed., Vol. 1). Harvard University Press Cambridge, Massachusetts, London, England.
Lemos, A. L. M., Bitencourt, E. C., & dos Santos, J. G. B. (2020). Fake news as fake politics: the digital materialities of YouTube misinformation videos about Brazilian oil spill catastrophe. Media, Culture and Society, c. https://doi.org/10.1177/0163443720977301
Machado, C. C. V., Dourado, D. A., Santos, J. G., & Santos, N. (2020). Ciência Contaminada: Analisando o Contágio de desinformação sobre coronavírus via youtube. 51.
Marres, N. (2017). Digital Sociology: The reinvention of Social Research. Polity Press.
Marres, N., & Gerlitz, C. (2015). Interface Methods. Media Studies, 2011, 1–32.
Omena, J. J., & Amaral, I. (2019). Sistema de leitura de redes digitais multiplataforma. 2010, 121–140. https://run.unl.pt/bitstream/10362/96559/1/JJ_Omena_I_Amaral_Sistemas_de_leitura_de_redes.pdf
Omena, J. J., Rabello, E. T., & Mintz, A. G. (2020). Digital Methods for Hashtag Engagement Research. Social Media and Society, 6(3). https://doi.org/10.1177/2056305120940697
Rieder, B. (2020). Engines of Order: a mechanology of algorithmic techniques.
Rieder, B. (2013). Studying Facebook via Data Extraction: The Netvizz Application. Proceedings of the 5th Annual ACM Web Science Conference, 346–355. https://doi.org/10.1145/2464464.2464475
Rieder, B., Matamoros-Fernández, A., & Coromina, Ò. (2018). From ranking algorithms to ‘ranking cultures’: Investigating the modulation of visibility in YouTube search results. Convergence, 24(1), 50–68. https://doi.org/10.1177/1354856517736982
Rogers, R. (2018). Otherwise engaged: Social media from vanity metrics to critical analytics. International Journal of Communication, 12(January), 450–472.
Souriau, E. (2015). The different modes of existence (E. Beranek & T. Howles (trans.)).
Stengers, I., & Latour, B. (2015). The Sphinx of work. In The different modes of existence (pp. 11–87).
Van Dijck, J. (2020). Seeing the forest for the trees: Visualizing platformization and its governance. New Media and Society. https://doi.org/10.1177/1461444820940293
Van Dijck, J., Poell, T., & Waal, M. De. (2018). The Platform Society. Oxford University Press, USA.