
Project title: Cross-platform digital networks: Exploring the narrative affordances of force-directed layouts and data relations nature
Subproject title: #Coronavirus: Social media and the early stages of a global pandemic
Final presentation slides
Team members (alphabetical order): Débora Alves, Géraldine Bengsch and Elisa Kannasto
Key Findings
Introduction
Research Questions
Research Design & Visual Protocol
Findings
Discussion
References
Key Findings
Social media platforms provide specialised forums for engaging with serious topics, including a (future) pandemic. Networks provide insights into topics in real time and contribute important understandings of local, societal, as well as global concerns. Trending hashtags are used to promote unrelated content.
Introduction
Networks with their analysis develop the global structure of interactions as they are present within a system. Phenomena emerge, and ideas, but also epidemics spread in networks (Caldarelli & Catanzaro, 2012). For the hashtag we chose for this project, this is true both in real life as well as in its online presence. At this time, unlike other strains of the virus, such as discussed in Anderson and Baric (2012), coronavirus had not reached the state of a pandemic. Data was collected at the end of January 2020, when #coronavirus was a topic of global interest – unlike other strains of the virus, such as discussed in Anderson and Baric (2012) but had not reached the state of a pandemic1. Moreover, coronavirus as a global topic affecting all the corners of the society, we understood that it was crucial to see what kind of networks have developed from around the discussion and how the topic evolves on different platforms.
Considering social media platforms as powerful tools in publicising, mediating and shaping perceptions of public concerns (Burgess & Matamoros-Fernández, 2016), we took advantage of the affordances of social media research which has begun to advocate the study of content like hashtags and related visuality across platforms (Pearce et al., 2020). The results of this exploratory study provide a snapshot of global social media activity across several social media platforms and their individual affordances related to the online treatment of the novel coronavirus upon its early appearance in public interest. This data sprint report was finalised in March 2020, shortly after COVID-19 had been declared a pandemic by the World Health Organization.
Situating the case study (or the first trials and errors )
We began the study by choosing the following platforms and methods of collection:
- Facebook – collect the posts and comments of the public page Coronavirus (25000 followers), possible text analysis (Voyant Tools) to see how the discussion is. The API does not provide information that could be used for network analysis, but this content can be used for content analysis to see what the communities are discussing.
- Instagram – Using Instagram Scraper with the hashtag #coronavirus for both co-tag and image analysis.
- Twitter – NodeXL map collected from Twitter with the hashtag coronavirus
- Google Trends was browsed with the search words coronavirus and coronavirus to build context before the actual research.
- YouTube DataTools was added to the project later because Facebook did not provide a lot of data for exploration.
Coronavirus as a topic offers a possibility for content across the globe, not only limited to English, but rather how a global community forms around a topic. It also offers a unique view on a current topic, which at the time of data collection provided novelty interest, but in a matter of months now touches and affects everyone worldwide. These networks provide insight on social media content around a topic that would later become a global pandemic. A follow up study might compare our networks with their time-specific content to data sets collected during the pandemic.
The initial Research Questions were:
- Do the Google trend results form a pattern with the known infection cases?
- How is #coronavirus used in different platforms, such as Instagram and Twitter?
- How is coronavirus discussed on Facebook?
- Is there misinformation regarding coronavirus?
After working on the project (data exploratory analysis), the aim and the research questions were re-formulated.
The aim was to learn about networks around the discussion on coronavirus. This was done using the following research questions:
- How is #coronavirus used in different platforms, such as Instagram, Youtube and Facebook?
- What type of networks are seen in use of #coronavirus on Instagram?
- What type of networks form from Youtube recommended videos around the topic of coronavirus?
- How is coronavirus discussed on Facebook?
During data analysis, we discovered possible unrelated hashtags (such as love, business, marketing) in the Instagram co-tag network, due to that the following questions were added:
- What type of visual content is being shared on Instagram?
- What is the role of visual content in communicating about the novel coronavirus?
Research Design Visual Protocol
Methodology
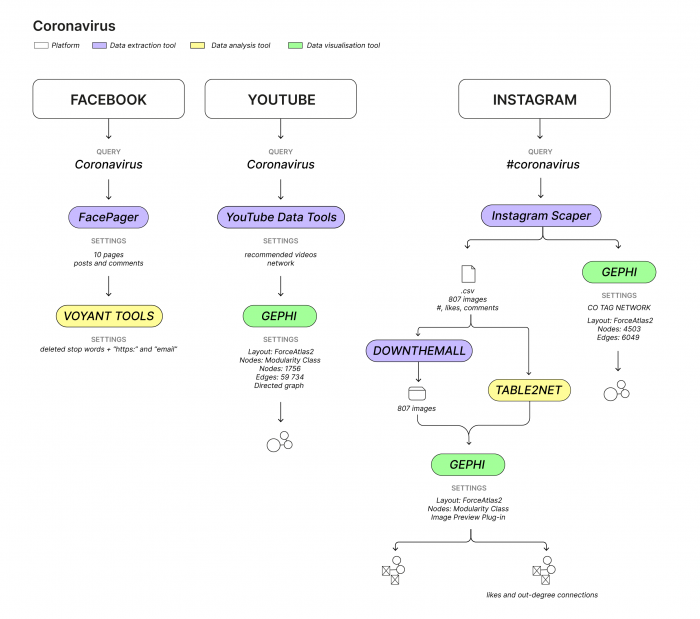
The following sections reunite the query design and methodology of our case study about coronavirus which contemplated Facebook, YouTube and Instagram platforms. We relied on a single keyword – “coronavirus” – to study current trends, as well as to identify its related dominant voice, positioning, commitment, concern and alignment (Rogers, 2019, p. 37). The networks were analysed with basis on their visual affordances (Venturini et. al. 2015; 2019) and the narrative affordances of force-driven algorithms (Omena & Amaral, 2019; Omena, 2019), with particular focus on the performance of ForceAtlas2 (Jacomy et. al. 2014). We also relied on a methodology that “makes algorithmic outputs visible” – or a way of studying YouTube ranking culture (Rieder et. al. 2018) by visualising the results of YouTube recommender algorithm concerning “coronavirus” in the shape of a network.
Query Facebook Graph API through Facepager using the keyword “coronavirus”
Facebook Page: Coronavirus
Extraction software: Fagepager
Analysis software: Voyant tools
We used the presets on Facepager (Jakob and Till, 2019) for collecting posts and comments, the maximum number of pages was changed from 1 to 10. The site has no ownership mentions, but it seems to be owned by some news site because most posts are shared news from globalnews.ca. After the collection, we used Voyant to perform text analysis to the comments on Facebook. The added stop words were https: and email, otherwise we used the automated list of stop words.
- YouTube
Query: Coronavirus
Extraction software: YouTube Data Tools
Analysis software: Gephi
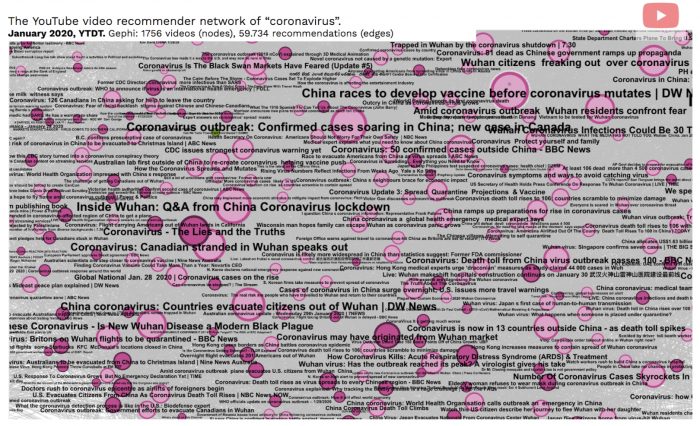
We worked with YouTube Data Tools (Rieder, 2015) to see what kind of recommendation video network there is already on videos that are found with the search coronavirus. The final video network shows the videos are related to “coronavirus”. Coronavirus was used as a search word and the search results were imported to Gephi and then analyzed there.
Query: Gephi
settings: Layout: ForceAtlas2
Nodes: Modularity Class
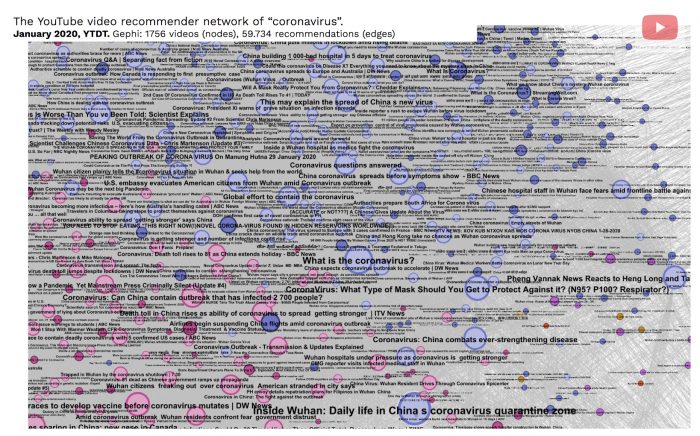
Nodes: 1756
Edges: 59 734
Directed graph
#coronavirus co-tag network
A query-based on exact matches is said to demonstrate alignment or lack thereof. Here it is noticeable that language and its use change over time (Rogers, 2019).
Query: #coronavirus
Extraction software: Instagram Scraper
Analysis software: Gephi (layout algorithm: ForceAtlas2)
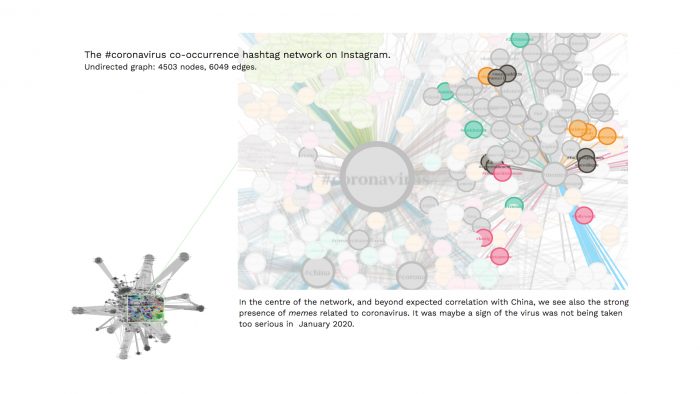
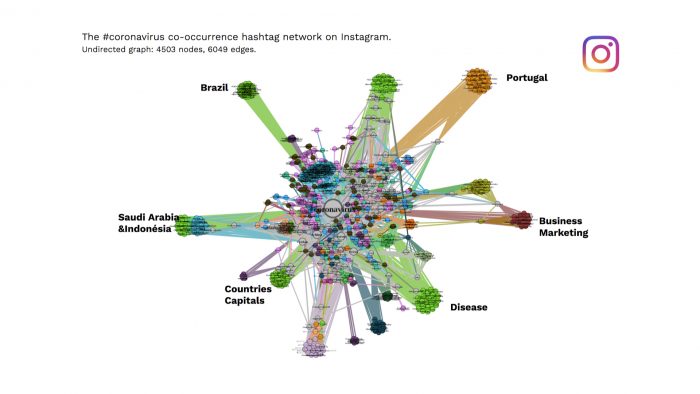
Undirected graph: 4503 nodes, 6049 edges
The main limitation found was that we were unable to find a relationship between the use of the coronavirus hashtag and the posts made, despite the fact that we detected it to be a widely used hashtag.
We use the presets of InstagramScraper to collect the Instagram posts and images who have a relation with coronavirus. In the process of data collection and analysis we encountered some limitations. The first was when we downloaded our csv file, the images were able to correlate with the post’s and the hashtags didn’t appear. The second limitation we found is that both people in the group were new to the software, which delayed the visualization process. We can say that the limitations we had were more at technical levels than at the level of the process chosen to carry out the analysis of our visual network.
After collecting the data, from the csv file, since we had a problem analyzing the csv file, we output the Instagram Scraper again, to a gdf file, and open it directly in gephi. After opening the file, in Gephi, we move on to technical procedures in order to be able to correctly and clearly visualize the hashtags, where the center of the visualization, the middle ground, its periphery and the isolated members were.
#coronavirus hashtag-image network
Query: #coronavirus
Extraction software: Instagram Scraper
Analysis software: Gephi (layout algorithm: ForceAtlas2)
Direct Graph (mixed): 5405 nodes and 8640 edges
Nodes: type, in-degree/out-degree
Activities (resonance measures) like, comment
Step-by-step to build an hashtag image network:
Using the results of the #coronavirus co-tag network, we follow the practical lab on “Building hashtag-image networks” by Elena Pilipets.
- We generated a .csv file containing 807 images with associated hashtags, number of likes and comments.
- The google extension DownThemAll was used to download all pictures from the dataset.
- Images were then resized using Bulk Resize.
- We added picture preview to google sheets to get an idea about the kind of pictures present in the network.
- We also added a column to name the pictures in a number.jpg format. After that, we save the spreadsheet as a .csv file.
- The resulting table was uploaded to table2net to generate a bipartite network, using the labels “hashtag” and “number.jpg” to make the network.
- In gephi, the network was spatialised using ForceAtlas2 and coloured by Type: hashtag and image.
- Use the Image Preview Gephi Plug-in, to turn one type of node into images and visualise the corresponding hashtags (the other type of node).
- A second visualisation was produced by re-spatialising the network by likes and out-degree connections.
Limitations: The hashtag- image network uses a multipartite graph. As a network with multiple nodes (vertices) belonging to different groups, the two that were chosen for analysis were the image and the hashtag (Cherven, 2015).
On a more practical level, during the day, Gephi kept producing a run error, and would not display the network correctly. Despite best efforts by helpful people, we were unable to generate the network. The network was therefore not analysed during the data sprint itself, but after. Over the following weeks, the network was successfully constructed, but the image preview plugin continued to create an error for SVG export, making analysis somewhat difficult. The pdf version was imported into Adobe Illustrator to maintain a vector version of the network.
Comments on the Coronavirus Facebook Page
The most used words suggest that the discussion is focused on China, Wuhan (the origin of the virus), coronavirus, virus (the case) and health, cure, symptoms, spread, disease, sars, research, biological, so welfare related issues. There are also mentions of god, world, travel, military, warfare, institute, people and weapons. This implies a similar direction of discussion that on the news and information on coronavirus publicly so far. 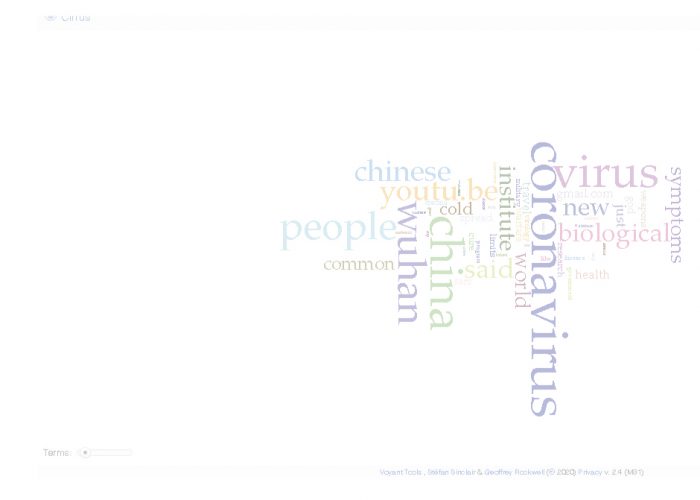 Facebook has the limitation that the API restricts collecting any personal data so for example users who are commenting are not treated as individuals with a specific code so that a network analysis could be performed. Therefore, analysing Facebook is limited to text analysis or analysing results on the comments or posts on a public page. It is clear that coronavirus is discussed on multiple forums on Facebook but that discussion is hard to track and systematically collect as data. The biggest limitation to this is that the Facebook API restricts any collection of data, with the exception of certain information gathered from Facebook public pages or events on Facepager. We were also unsuccessful in fetching the reactions per post, the totals were the only possibility. However, in the end this was not needed for analysis so it did not restrict our process.
The recommendation network of “coronavirus” videos on YouTube
In the centre of the network we see the two biggest and most dense clusters, where we detected mainly video content in English and videos treating the epidemia from an international context perspective. One of the most central videos is made by an english teacher working in Wuhan reporting his life under quarantine. The other cluster in the center is the video reports on China. The two clusters in the center overlap, meaning also that, in the end of January 2020, when watching videos created by International news and reports on coronavirus, one would also receive as first recommendations (and very probably watch) the videos of news focused on China.
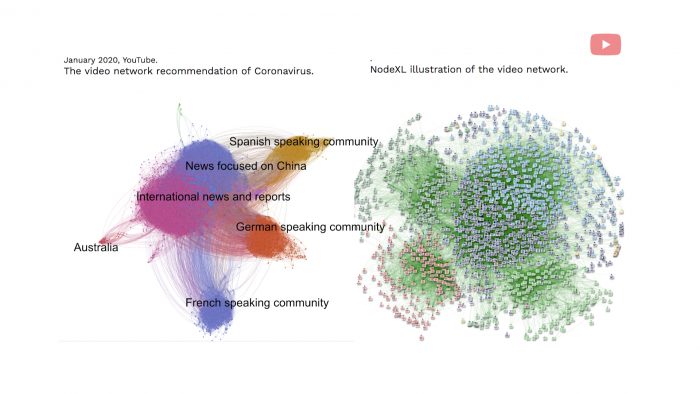
International news agencies and their reporting videos are the most connected content on Youtube related to coronavirus. In the centre of the network, we also see the most connected videos are the following:
- The Guardian: What is coronavirus? – expert video with reporting.
- FOX News on Trump’s case – reporting CNBC on spread of virus in China Channel 4 News on china and how the virus can be contained.
- DW News on China developing vaccination
As a way to document the main clusters of the network, see below the screenshots of the videos and related themes highly recommended on YouTube platform in the last week of January 2020. Beyond news about the outbreak of the virus in China, we also see information about the virus itself, prevention measures, a scientist explaining that coronavirus is worse than we´ve been told, how to stop the virus, and the lockdown in China, among others.
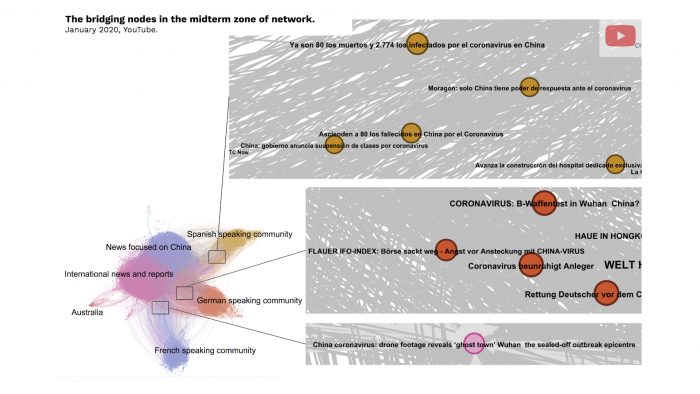
The second factor in connections is the language, and possibly country. In the periphery area of the network, there are three country based clusters strongly connected to the centre. They are the German, French and Spanish speaking video communities. In a more isolated area, on the left, one cluster that is still pretty connected to the center is discussing Australia (see in the visualization the bridging videos that connects these clusters to the centre of the network).
The network of co-occurrence of #coronavirus on Instagram
In the centre of the network, as expected the tag #coronavirus is closely related to #china, #coronavirusoutbreak and #corona. We see also the strong presence of #memes, which may point to a laid-back attitude indicating a lack of preoccupation or concern about the virus.
#whuan appear with some prominence in the midterm area of the network, such as tag like #health, #illness, #quarantine, #virus; these hashtags are not only directly related to coronavirus, but also informs the issues and new life conditions (e.g. obligatory social distance) provoked by the disease. In the mid-term, we can also observe something curious correlations, for instance, in the upper right corner, there are Portuguese words, such as #rostoperfeito (perfect face), #tratamentosalternativos (alternative treatments), #mulherportuguesa (portuguese women), and some of the main cities of Portugal: #coimbra, #aveiro and #cidadedoporto (Porto city). These mentions may point to hijacking hashtags.
In the periphery, we were able to detect something curious in terms of the organization of clusters. As if they were divided into categories. For example by countries, such as Brazil, Portugal, Saudi Arabia, Indonesia. The Indonesian cluster is very close to Saudi Arabia. These clusters reveals very specific representations about #coronavirus. In the case of Brazil, for instance, the cluster brings meme-related content (e.g. coronavirus came to Brazil to fight with Dengue) through the tagged name of brazilian celebrities (e.g. Anitta).
Before building our hashtag-image network, we first looked at preview of the pictures (with the help of the Google Spreadsheet image formula), and noted some completely unrelated pictures, such as friendly cats:

It was noticeable that a vast majority of the 806 pictures had very few likes and comments. Only 34 pictures have more than 100 likes; three have more than 1000, with the top one 3016. Out of the 34 topmost liked pictures, 10 pictures contain humorous or unrelated content. The table below provides examples of the type of content present in the network.
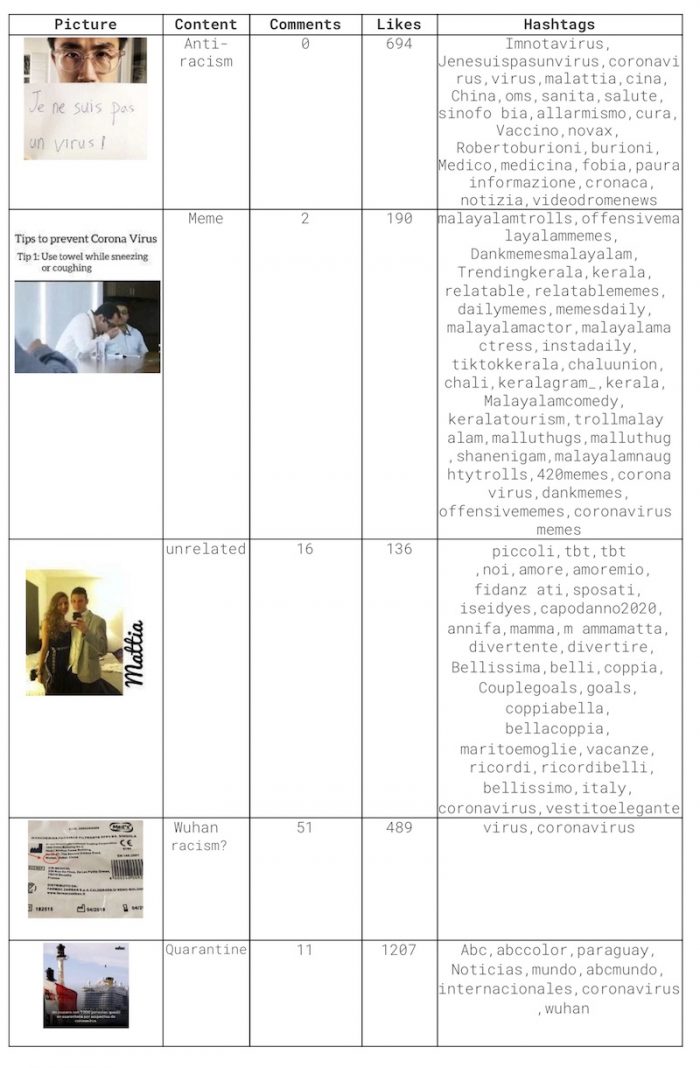
Research has shown that social media platforms can contribute to perpetuating racism (Matamoros-Fernández, 2017). The coronavirus network contains examples of both racism and anti-racism (see table first picture and second to last).
The network contains a considerable number of hashtags related to humour, such as “offensivememes”, “wedead”, “familyguymemes”, “indianmemes”, “hindimemes”, or unrelated tags, such as “gaming”, “followforfollow”, “businessmemes”, “starbucks”, “lovecraft”. Content is accelerated and amplified across the network (Matamoros-Fernández, 2017)
In addition, the memes, but also other hashtags reference “corona”, a Mexican beer. While our query was supposed to be unambiguous, language associated with it is ambiguous. For this project, we concentrated on the query issue, but also allowed room for actors’ terminological innovation (Rogers, 2019), and, as can be in the example here, also to cross-reference other social media platforms, here Facebook.

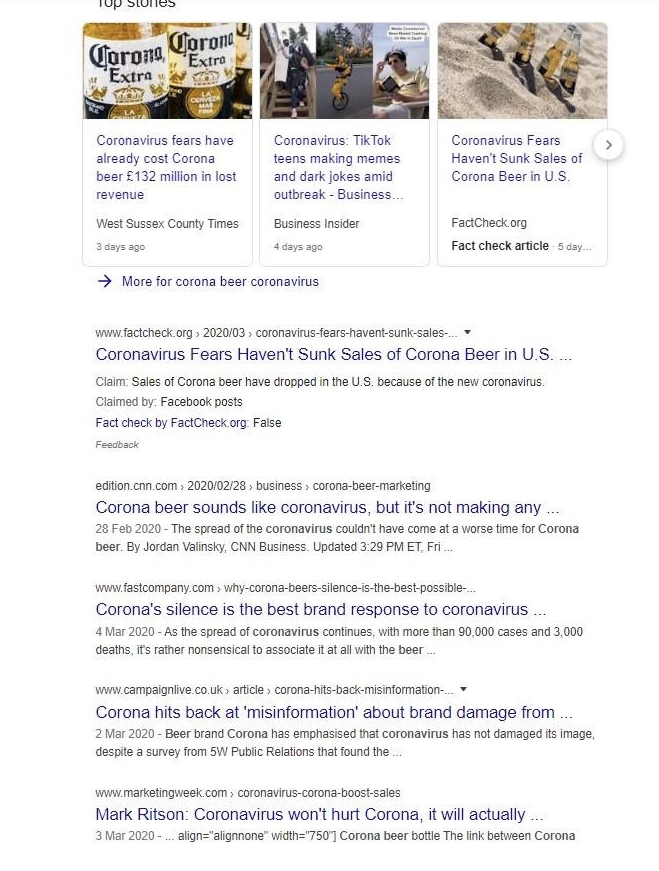
It has to be noted that a network will give a picture of how actors within it understand and treat a topic. As this analysis across platforms shows, social media caters to the interests and concerns of its users. A Google search for “corona beer” in March 2020 shows that news outlets portray different and additional angles on a topic.
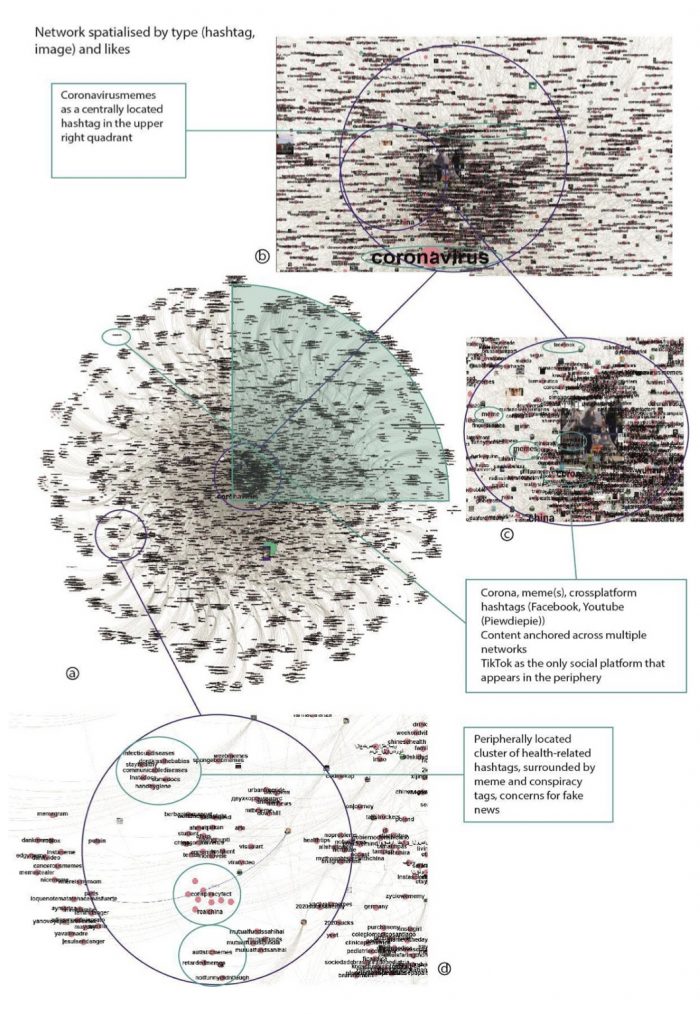
The shape of the network suggests a core-periphery model, in which the original search term “coronavirus” is at the centre with surrounding clusters (Borgatti, Everett, & Johnson, 2018). A quarter of the circle-shaped network, the upper right sector, is the partition in which hashtags regarding memes and unrelated content are most persistent (b). Additionally references to other platforms are found in this sector (with TikTok as an outlier) (c). In line with the general mood surrounding the topic of COVID-19 in January 2020, the network also addresses concerns for fake news and conspiracy in its hashtags (d).
 Instagram Image Hashtag network 2
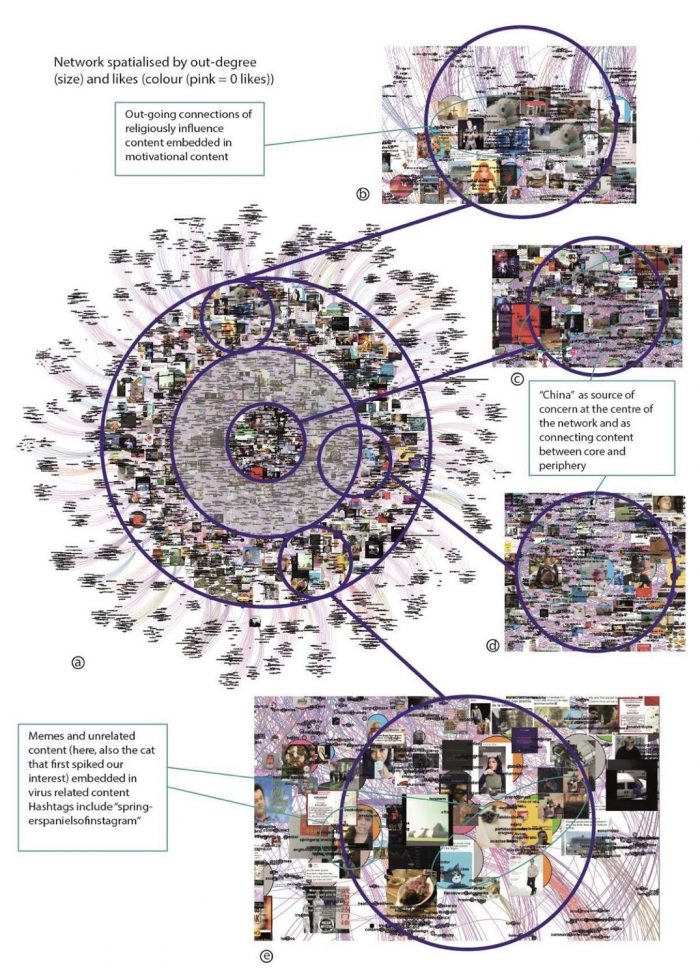
As a directional network, a large number of pictures is weighted heavily to Out-degree links (Cherven, 2015). Memes and unrelated content with out-degree links is present around the core hub and below the peripheral hubs. However, they are intermingled with other content, such as pictures of individuals in protective gear, health advice, requests for prayers, etc (b). As such, the humorous content (see e) blends into the surrounding content much more if memes are understood as a general storytelling device (Blackmore, Dugatkin, Boyd, Richerson, & Plotkin, 2000), and not reduced to the understanding that the hashtags in the network (that is, “funny memes”) promote. This develops a rich narrative. Core elements referencing “China” and “Wuhan” (c) connect to peripheral content (d) through imagery rated important in January, such as bats.
Discussion on the Image hashtag networks
In online behaviour, formal gatekeepers are absent, and behaviour is regulated among participating parties (Gal, Shifman, & Kampf, 2016). Users are able to have their say without outside interference (Rogers, 2019). As such, it can be described as “a socially situated form of contextualisation that recognises the interconnectedness of individuals in both formal and informal social structures” (Mercer, 2015, p. 75). However, this is not to say that ‘anything goes’, but rather that content is – to a degree – self-regulated. In the network, other social media platforms are cross-referenced, including YouTube gamer PewDiePie. His video including “edgy, racial” jokes has received criticism online (Kucher, 2020; Messamore, 2020).
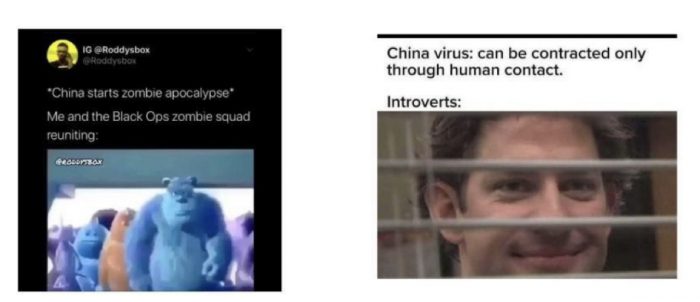
In an online environment, memes function as a representational discourse that generates new meaning (Huntington, 2013). Memes are more than just isolated ideas; they cannot be separated from ideas that pertain to other forms of discourse related to the context (Kuper, 2000). Memes describe patterns of cultural information that forms collective understanding (Knobel & Lankshear, 2007). Information “mutate” during use and through communication (Atran, 2001). Davison (2012) defines internet memes as “a piece of culture, typically a joke, which gains influence through online transmission” (p.122) which are characterised by the speed of their transmission. Memes have been compared to a virus in the way they spread (Rogers, 2019). This network provides insights into how users created content at the beginning of public awareness of the virus. In January 2020, social media platforms were overflowing with fake news items surrounding the virus and its spread (Mejova & Kalimeri, 2020; Perrett, 2020). While the idea of providing “comic relief” (Harris, 2020) remains the same in March, the content shared reflects the public’s concerns at a given time. In January, memes were reflecting the uncertainty surrounding the virus, and as such remained rather unspecific (although memes referencing TV show “The Office” will likely always be popular for meme creation, no matter the occasion):
Memes in the network
A network to be generated at the writing of this report (March 2020) would likely create very different content, as users’ concerns have shifted (Grey Ellis, 2020). Specific restrictions, such as hand sanitizer and toilet paper shortages, call for social distancing, and working from home (Harris, 2020) have become real and definite concerns that users are concerned and engaged with. Memes connect to other memes as multimodular units (Atran, 2001) to create a “memeplex” (Blackmore, 1999) allowing the message to be shared and passed around a network. The out-degree connections of individual pictures tie the network together. This shows that the hashtags on Instagram are exploited to promote unrelated content to a global crisis to a substantial degree. The amount of likes that some of these posts command may also suggest that it is a technique that will indeed increase visibility of unrelated content on a platform such as Instagram.
The virus is used by social media participants; a finding that extends from individuals to non- and for-profit organisations, including political campaigning (Mejova & Kalimeri, 2020).
Social networks blend production and consumption of personal and mass storytelling as dictated by contemporary social conventions. Stories are told through the use of data (Papacharissi, 2015). This image network provides insights into the fleeting, ever changing narrative surrounding the early stages of COVID-19 at the beginning of 2020. In March 2020, this network appears almost naïve in its predictable content and concerns that are incredibly far removed from the global pandemic the coronavirus turned into. Stories told in the network are those of sensationalism, entertainment, humour, fake news, alternative medicine, and conspiracy. It is a network that highlights the novelty of the virus that at the time had not yet affected millions of people on a global level. The network speaks to the newsworthiness of the novel coronavirus and the different angles communication around the topic has. It shows how ideas spread and disperse within, but to a degree also across social networks.
Anderson, L. J., & Baric, R. S. (2012). Emerging human coronaviruses—disease potential and preparedness. In: Mass Medical Soc.
Atran, S. (2001). The trouble with memes. Human Nature, 12(4), 351-381.
Blackmore, S. (1999). The meme machine (Vol. 25): Oxford Paperbacks.
Blackmore, S., Dugatkin, L. A., Boyd, R., Richerson, P. J., & Plotkin, H. (2000). The power of memes. Scientific American, 283(4), 64-73.
Borgatti, S. P., Everett, M. G., & Johnson, J. C. (2018). Analyzing social networks: Sage.
Burgess, J., & Matamoros-Fernández, A. (2016). Mapping sociocultural controversies across digital media platforms: One week of #gamergate on Twitter, YouTube, and Tumblr. Communication Research and Practice, 2(1), 79-96.
Caldarelli, G., & Catanzaro, M. (2012). Networks: A very short introduction (Vol. 335): Oxford University Press.
Cherven, K. (2015). Mastering Gephi network visualization: Packt Publishing Ltd. Davison, P. (2012). The language of internet memes. In The social media reader (pp. 120-134).
Gal, N., Shifman, L., & Kampf, Z. (2016). “It Gets Better”: Internet memes and the construction of collective identity. New Media Society, 18(8), 1698-1714.
Jacomy, M., Venturini, T., Heymann, S., & Bastian, M. (2014). ForceAtlas2, a Continuous Graph Layout Algorithm for Handy Network Visualization Designed for the Gephi Software. PloS One (9)6, e98679.doi:https://doi.org/10.1371/journal.pone.0098679
Jünger, Jakob / Keyling, Till (2019). Facepager. An application for automated data retrieval on the web. Source code and releases available at https://github.com/strohne/Facepager/.
Grey Ellis, E. (2020, 05/03). Is It OK to make Coronavirus memes and jokes? Retrieved from https://www.wired.com/story/coronavirus-memes-humor/
Harris, M. (2020, 13/03). Coronavirus memes are spreading as the disease travels across the world — here’s what they look like and why creators say they’re important. Retrieved from https://www.insider.com/coronavirus-memes-people-joking-about-covid-19-to- reduce-stress-2020-3
Huntington, H. (2013). Subversive memes: Internet memes as a form of visual rhetoric. AoIR Selected Papers of Internet Research, 3.
Knobel, M., & Lankshear, C. (2007). Online memes, affinities, and cultural production. In A new literacies sampler (Vol. 29, pp. 199-227).
Kucher, D. (2020, 23/02). Famous YouTuber PewDiePie criticized for jokes about Corona Virus. Retrieved from https://www.somagnews.com/famous-youtuber-pewdiepie- criticized-jokes-corona-virus/
Kuper, A. (2000). If memes are the answer, what is the question. In R. Aunger (Ed.), Darwinizing culture: the status of memetics as a science (pp. 175-188). Cambridge: Cambridge University Press.
Matamoros-Fernández, A. (2017). Platformed racism: The mediation and circulation of an Australian race-based controversy on Twitter, Facebook and YouTube. Information, Communication & Society, 20(6), 930-946.
Mejova, Y., & Kalimeri, K. (2020). Advertisers jump on Coronavirus bandwagon: Politics, news, and business. arXiv preprint arXiv:2003.00923.
Mercer, S. (2015). Social network analysis and complex dynamic systems. In Z. Dörnyei, P. MacIntyre, & A. Henry (Eds.), Motivational dynamics in language learning (pp. 73-82): Multilingual Matters.
Messamore, W. E. (2020, 21/02). PewDiePie laughs at Coronavirus in racially ‘edgy’ return video. Retrieved from https://www.ccn.com/pewdiepie-laughs-at-coronavirus-in- racially-edgy-return-video/
Omena, J.J. (2019). Reading Digital Networks: Climate Emergency, Bolsonaro & Bot Image Circulation by Vision API. The social platforms. Retrieved from https://thesocialplatforms.wordpress.com/2019/12/07/reading-digital-networks/
Omena, J.J., & Amaral, I. (2019). Sistema de leitura de redes digitais multiplataforma. In J. J. Omena (Ed.), Métodos Digitais: Teoria-Prática-Crítica. Lisboa: ICNOVA.
Papacharissi, Z. (2015). The unbearable lightness of information and the impossible gravitas of knowledge: Big Data and the makings of a digital orality. Media, Culture & Society, 37(7), 1095-1100.
Perrett, C. (2020, 28/01). People are spreading memes and fake news online as the deadly coronavirus spreads across the globe. Retrieved from https://www.insider.com/coronavirus-wuhan-memes-social-media-is-responding-to- the-illness-2020-1
Rieder, Bernhard (2015). YouTube Data Tools (Version 1.11) [Software]. Available from https://tools.digitalmethods.net/netvizz/youtube/.
Rieder, B., Matamoros-Fernández, A., & Coromina, Ò. (2018). From ranking algorithms to ‘ranking cultures’: Investigating the modulation of visibility in YouTube search results. Convergence : The International Journal of Research into New Media Technologies, 24(1), 50-68
Rogers, R. (2019). Doing digital methods: SAGE Publications Limited.
Venturini, T., Jacomy, M., Bounegru, L., & Gray, J. (2019) Exploração visual de redes para jornalistas de dados. In J. J. Omena (Ed.), Métodos Digitais: Teoria-Prática-Crítica. Lisboa: ICNOVA
Venturini, T., Jacomy, M., & Jensen, P. (2019). What do we see when we look at networks an introduction to visual network analysis and force-directed layouts. arXiv:1905.02202 [physics.soc-ph] Retrieved from https://arxiv.org/abs/1905.02202
Venturini, T., Jacomy, M., & Pereira, D. (2015). Visual Network Analysis. SciencesPo Media Lab working paper. Retrieved from https://www.researchgate.net/publication/278030230_Visual_Network_Analysis