
Facebook as a Political Platform: How Portuguese political parties engage with Facebook users
Project Leaders
Jorge Martins Rosa (Associate Professor, NOVA FCSH; Researcher, ICNOVA), N. Gizem Bacaksızlar Turbic (Post-Doctoral Researcher, ICNOVA), Alda Telles (Doctoral Candidate, NOVA FCSH)
Project Team
Clara González Tosat, Cristian Ruiz, Kalliopi Moraiti, Oğuz Özgür Karadeniz (Research Associate, KU Leuven DTAI), Svea Kiesewetter (Doctoral Student, University of Gothenburg), Valentina Pallacci (Master’s student, Politecnico di Milano; Intern, DensityDesign Research Lab)
Project pitch slides
Final presentation slides
Key Findings
Introduction
Research Questions
Query Design & Visual Protocol
Methodology
Findings
Discussion
References
- National Politics is the category most frequently used in political parties’ messages, with Europe appearing as a marginal topic even during the European Elections campaigns.
- Some topics/subcategories are almost monopolized by single parties, as IL for ”Economy and Fiscality” and PAN for “Animal and Environmental Rights”.
- Right-wing parties use more frequently messages that embody confrontation with their opponents than left-wing parties, with that confrontation apparently increasing during the campaign and pre-campaign period.
- Portuguese political parties don’t engage through emojis in their posts, being PAN the exception, although emojis are much more present in the comments to the posts.
- Facebook posts with images generate more engagement, and IL shows an obvious communication strategy based on imagery, giving them a clear predominance in images with more reactions.
- This engagement with image posts is highly significant when considering “other reactions” (Haha, Wow, Sad, Angry), although the prevalence of posts from IL may have introduced a bias in the analysis.
With the continuous rise in the use of online communication by the general public, political parties are becoming increasingly present on social media platforms (Macnamara, 2011; Enli and Skogerbø, 2013). The online conversations and interactions on social media provide an exhaustive source of data on political engagement, opinion dynamics, and online community structures compared to the limited traditional sources, such as interviews and surveys.
This research project aimed at characterizing the communicational engagement of the users (demand side) with the Portuguese political parties on the social network platform Facebook. The posts from the pages of the Portuguese political parties which are represented in the parliament elected in 2019 (cf. Appendix I: List of political parties) were retrieved before, during, and after the election campaigns for the European parliament and for the national Legislative Elections.
We investigated how the communicative exchange took place on Facebook, in order to have a more accurate description of what happened both on the supply side and on the demand side. The activity on the supply side can be measured by the number of posts from the page owners, i.e. political parties, while from the demand side it can be measured by the number of comments, shares, likes, and other reactions (Love, Haha, Wow, Sad or Angry) from the Facebook users (Effing et al., 2011). These interactions, commonly explained and analyzed as user engagement (Stetka, Surowiec, & Mazák, 2019; Stromer-Galley, 2003), are the major metrics used in literature.
Our objective was to analyze public emotions related to political subjects by considering other methods rather than the traditional ones involving interviews and surveys, which, due to the cumbersome process of gathering the data, typically limit the population sample available for the analysis. Therefore, our first goal was to use Facebook data to access the interactions and engagement of users with posts published by political parties, and among each other in relation to these subjects.
This project’s second goal was to investigate what reactions actually mean and to apply sentiment analysis (positive and negative sentiment) on the posts from the periods of before, during, and after the European and Legislative Elections in Portugal, 2019.
For the purpose of this study, posts from the Portuguese political parties were collected using Facepager, a tool for fetching publicly available data from various websites (Jünger & Keyling, 2019). The data sets for the periods of two major elections and related electoral campaigns, subsets of a more complete data (more than 9000 posts and more than 100,000 comments covering a period of 18 months), were made available as CSV files.
The methodology was focused on content and sentiment analysis of the posts with the highest level of interactions and also with the highest level of “other reactions” (i.e., reactions other than Like or Love) during those two periods. For the comparative analyses and outcomes, the political parties were mapped according to their foundation time (older if founded before 2000 vs. newer if founded after that date), and political position (left vs. right, with a further division between left-wing, center left, center-right and right-wing when needed). Other specific data from those subsets – namely the images embedded in the posts and the emojis within the posts and the comments – were gathered as the project developed.
- RQ 1: How differently official parties try to engage with Facebook users in the two major 2019 elections periods in Portugal?
- RQ 2: What type of content receives the most attention and engagement from the users?
Query Design & Visual Protocol
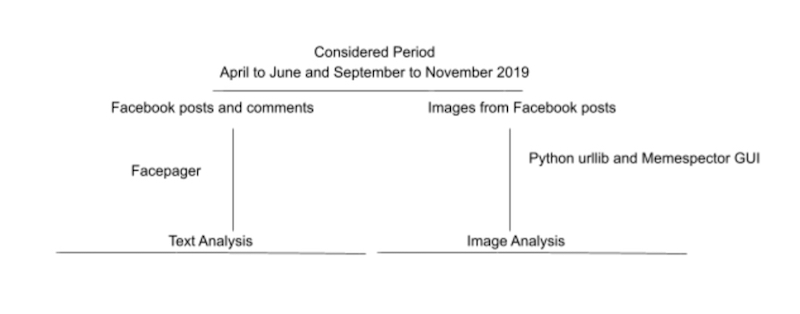
Figure 1. Query design.
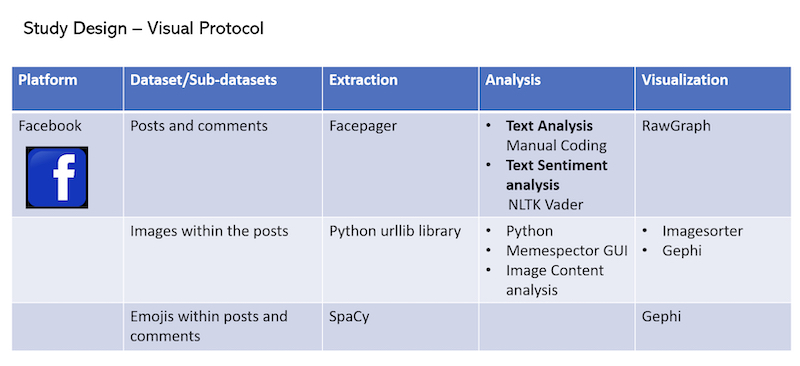
Figure 2. Visual Protocol.
To answer RQ 1 (How parties try to engage with Facebook users?), we looked at the posts’ content, namely text, images and emojis.
The posts with more “other reactions” were considered for manual coding of categories, which were then analysed and ran through several visualization techniques. As a complement, word frequencies were also taken into account, both for these posts and for those with more interactions. Images and emojis on posts were also subject to analysis, as described in more detail below. Finally, posts and comments were subjected to sentiment analysis with NLTK VADER.
In order to answer RQ 2 (What type of content receives more attention and engagement?), we additionally looked at comments to the posts, and particularly at emojis within those comments, using SpaCy for retrieval and Gephi for visualisation. Given that the subsets of data (cf. below) were already selected due to being the top rated regarding interactions or “other reactions”, the techniques used to answer RQ 1 were also valid for RQ 2.
- Data sampling
Two 3-month periods (April to June and September to November 2019) were chosen, in order to cover two months before each election, which include both the official campaign time and the “pre-campaign” time, and the month after. These periods also correspond to those with higher activity from the supply side, i.e., the higher values of published posts by the political parties in their Facebook official pages, as shown in Figure 3.
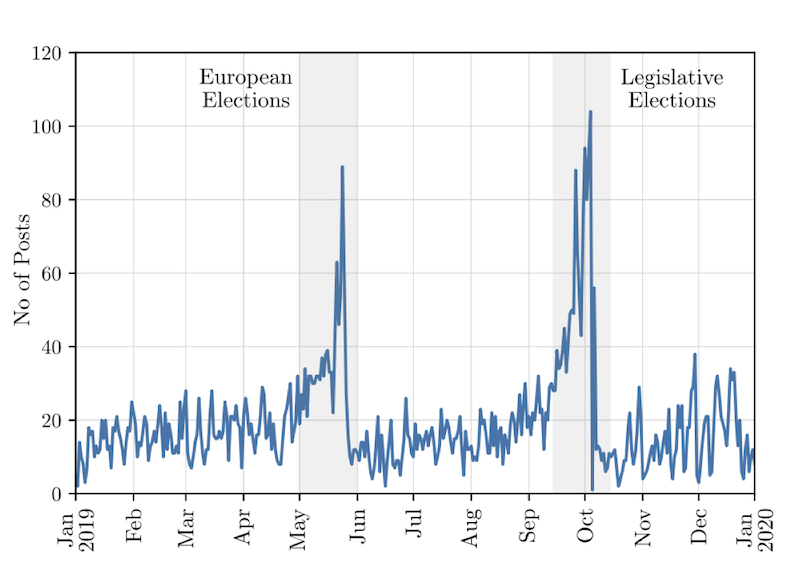
Figure 3. Post activity over time (all pages/parties).
Within these periods, we then selected the top 100 posts for each period with 2 filters:
- a) Top 100 posts with all interactions (reactions + comments + shares)
- b) Top 100 posts with “other reactions” (Love, Haha, Wow, Sad and Angry)
A similar approach was taken for the top 100 comments:
- c) Top 100 comments to posts with all interactions
- d) Top 100 comments to posts with “other reactions”
2. Data processing
- Text
– Posts and comments were translated from Portuguese to English with Google Translator.
– Text sentiment analysis was processed with NLTK. VADER (Hutto & Gilbert, 2014), a model used for text sentiment analysis that is sensitive to both polarity (positive/negative) and intensity (strength) of emotion.
– Emoji extraction, through text description, was carried out with SpaCy, an open source software library for advanced natural language processing with the community maintained addon Spacymoji.
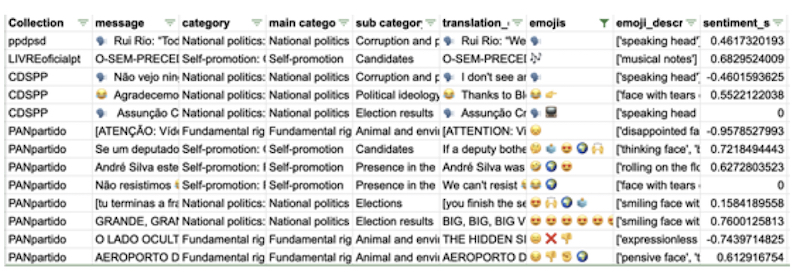
Figure 4. Sample from data, showing fields added to the original CSV files (categories, emojis, etc.).
- Images
After being retrieved with the help of Python urllib library, the images belonging to the corpora were processed with:
- Google Vision API, with a particular focus on the Face and Safe features detection, with these features visualized with the help of heatmaps.
- Image Sorter, which allows the grouping of images according to several criteria, e.g. by color resemblance.
- Features such as labels, likes, and feature scores were plotted into image content networks using Gephi.
- Text
- Categorization
The two sets – one for the European Elections, one for the Legislative Elections – of 100 posts with the highest rate of “other reactions” were analyzed and classified manually, using a list of categories and subcategories from a previous similar analysis.
The classification was done by four coders which independently classified 50 posts each. Intercoder reliability was assessed first by the categorization and later comparison of a small sample, done by all 4 coders, until consensus was reached. The total of 200 posts was subject to a further round of mutual verification, in order to strengthen the reliability.
Both in the first and second rounds, some of the initial categories had to be readjusted and also some others had to be created, in order to fit the data more thoroughly (see Appendix II: List of categories). While some posts may have benefited from a multiple categorization approach, in order to keep the task more manageable within the time limits of the data sprint, each post was classified with only one category, considered as the dominant when others also were suitable candidates.
The data for each election, with added categories and subcategories, were sorted and analysed according to several criteria, of which 1) the frequency of each category and subcategory in each election, and 2) the frequency and ratios of categories for each party yield the most relevant interpretations. The corresponding distributions for European and Legislative Elections were visualized using the RAWGraphs tool and are shown in Figures 5 and 6.
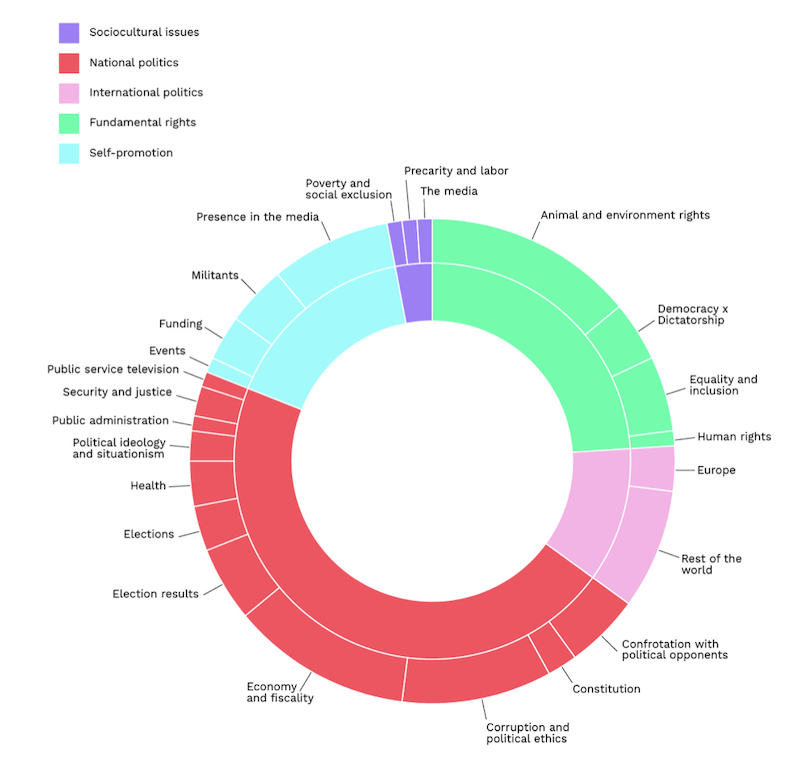
Figure 5. European Elections categories (all parties).
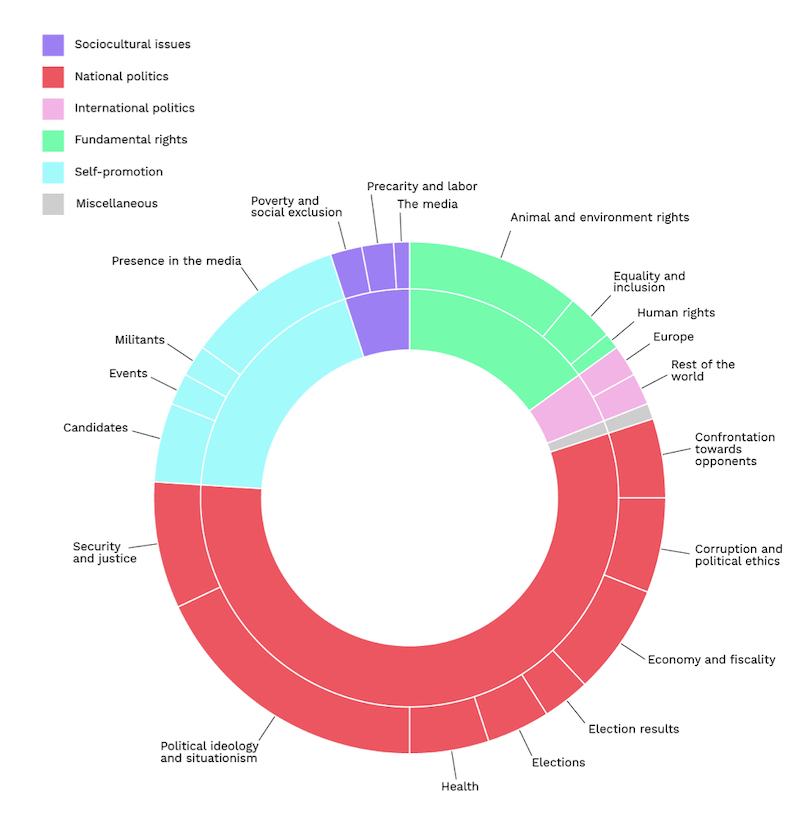
Figure 6. Legislative Elections categories (all parties).
Content analysis of the top 100 European Elections posts with more “other reactions” (Figure 5) highlighted the following results:
- The most frequent category is “National Politics”, with “Economy and Fiscality” and “Corruption” as its most frequent subcategories.
- “Fundamental rights” appear as the second most frequent category, although this result is biased by the predominance of the “Animal and Environmental Rights” subcategory in PAN’s posts.
- Surprisingly, the category “International Politics” is not only the second less-frequent category during European Elections, but the “Rest of the World” subcategory surpasses the subcategory “Europe”.
The analysis of the top 100 Legislative Elections posts with more “other reactions” (Figure 6) highlighted the following results:
- In national elections, the weight of the “National Politics” category is overwhelming, as one might have expected, with the subcategories “Security and justice” and “Political ideology” being more frequent than in the European Elections.
- The “Self-promotion” category is also more frequent than in the European Elections, with “Presence in the Media” and “Candidates” as the most frequent respective subcategories.
- The “Confrontation with political opponents” subcategory grows in the Legislative Elections.
The clouds for most frequent categories (Figures 7 and 8) confirm the previous analysis, showing how some categories shift in importance between the European and the Legislative Elections.
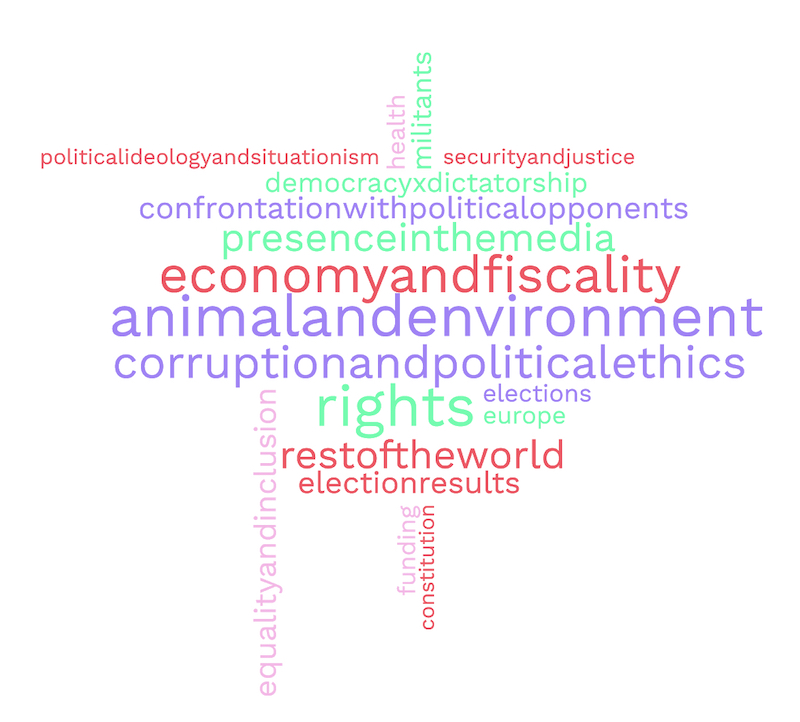
Figure 7. European Elections category cloud (all parties).
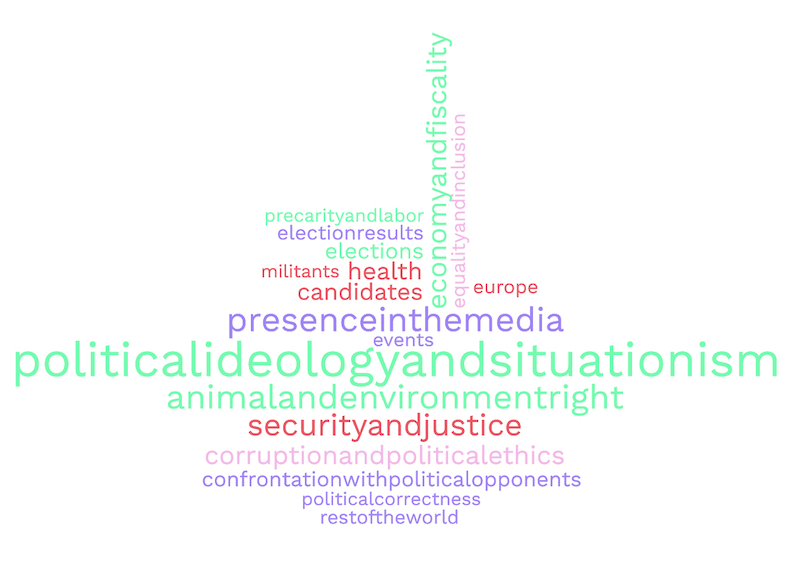
Figure 8. Legislative Elections category cloud (all parties).
A similar analysis was applied at the party level (Figure 9), this time considering the 200 posts as a whole (i.e., both European and Legislative Elections), in order to assess individual party strategies.
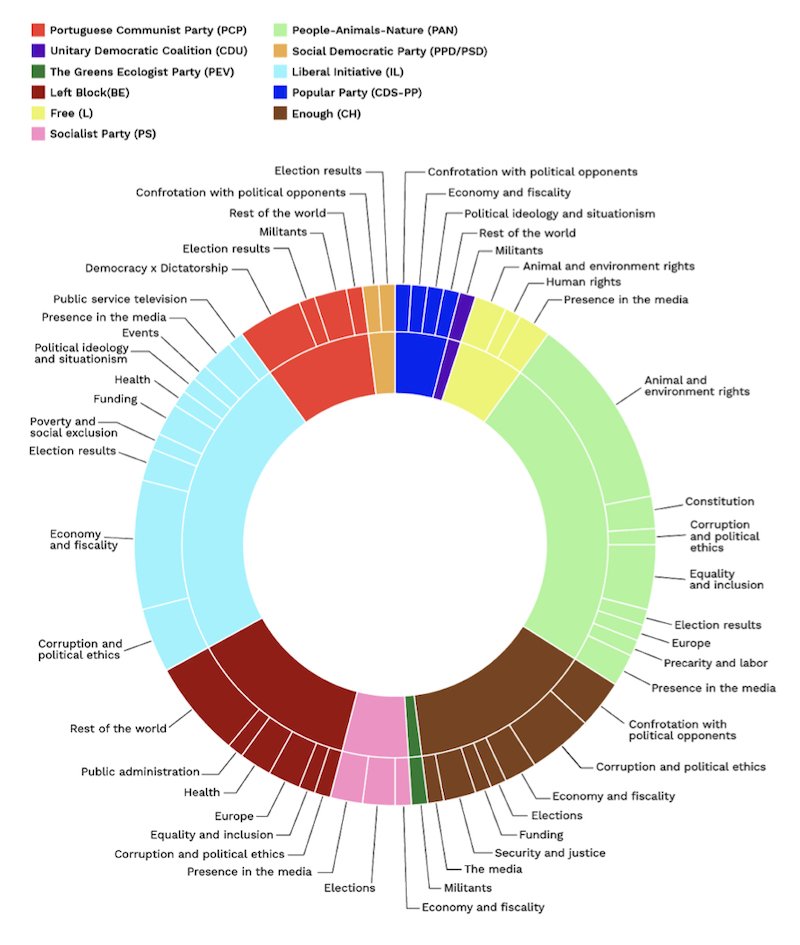
Figure 9. Most frequent categories by political party.
Although the corpus only considers the posts that achieved higher levels of “other reactions”, which may disallow a generalization, some evidence can be highlighted:
- The 3 right-wing parties (CDS-PP, IL and CH) have “Confrontation with political opponents” as a more frequent subcategory than other (left, center-left and center-right) parties.
- Left-wing parties (BE and CDU) relate more to “International Politics”
- Some subcategories are almost monopolized by one single party, as IL for ”Economy and Fiscality” and PAN for “Animal and Environmental rights”, favoring their classification as “single-issue parties”.
- Word frequency
Word clouds were also generated for the most frequent words across the corpus, again separately between the European (Figure 10) and the Legislative Elections (Figure 11). Due to time constraints, there was no attempt at a correlation between words and categories.
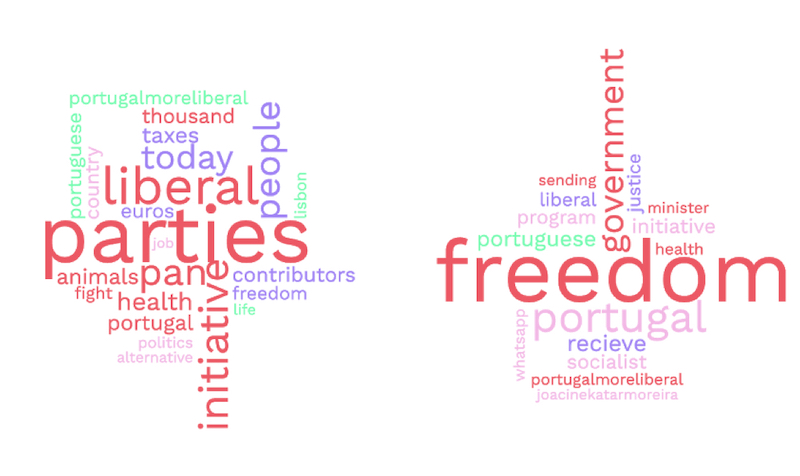
Figures 10 and 11. European elections and Legislative Elections most frequent words (all parties).
If we assume that “liberal” and “initiative” are almost exclusively used by the new political party that uses those words in its name (IL), we may extrapolate that they had a dominant role in reaching the attention of the public during the European Elections, even if they then failed to elect an MP.
In the Legislative Elections, the word “freedom” stands out, which is consistent with the weight of both “Fundamental Rights” as one of the most common categories and “Political ideology and situationism” as one of the dominant subcategories.
- Usage of emojis
Emoji frequencies in the posts were also analyzed, and visual depictions were created with RAWGraphs. The next two visualizations show, for all four subcorpora, emoji frequencies in posts (Figure 12) and in comments (Figure 13) distributed by parties.
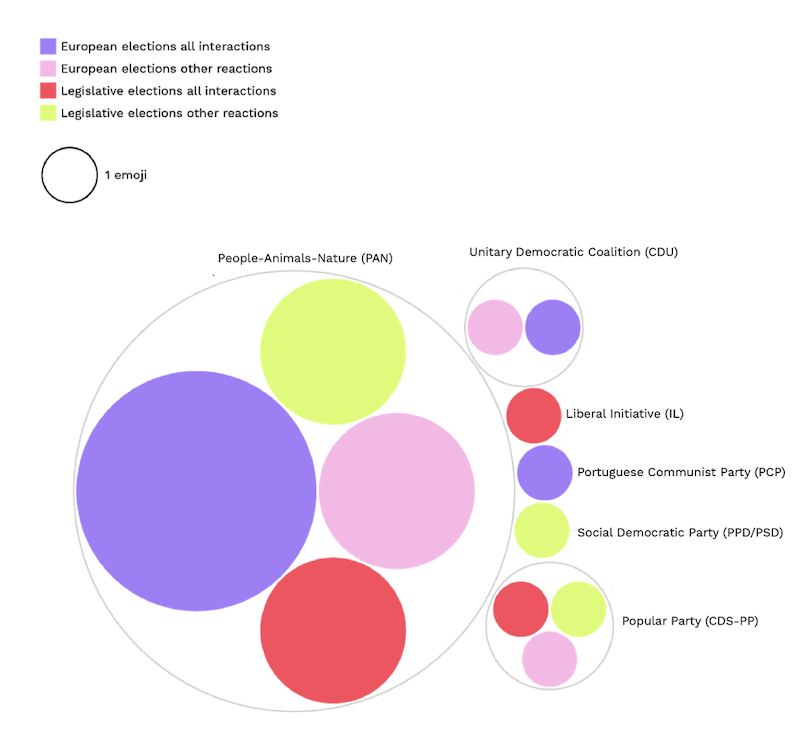
Figure 12. Emojis on posts (divided by parties).

Figure 13. Emojis on comments (divided by parties).
The analysis revealed that political parties hardly used emojis in their posts; to be more precise, only those represented in Figure 12 used them across the corpus. However, a more substantial amount of emojis could be found in the comments to the posts, as discussed just below. The most significant discovery was that PAN is by far the only party that regularly uses these special characters. Being also the one with more emojis in comments (Figure 13), one could speculate if the usage of emojis in posts is read by the audience as an incentive to also use them in comments.
Considering that emojis were more frequent in comments, the following two visualisations show those that were more frequent in the comments to the posts with more “other reactions”, first in the European Elections (Figure 14), and then in the Legislative Elections (Figure 15).

Figure 14. Most frequent emojis in the comments for European Elections “other reactions”.

Figure 15. Most frequent emojis in the comments for Legislative Elections “other reactions”.
The results are not particularly noteworthy for the European Elections, but for the Legislative Elections we found a curious collection of emojis with several money-related pictograms (money bills, money bag,..), besides the more predictable smiley faces. No correlation with the content (or the categories) of the posts was made due to the time limitations of the data sprint, although that may be of help in finding a plausible explanation – e.g., those particular emojis may be related to posts belonging to “Corruption and political ethics” or similar categories.
- Sentiment analysis
Sentiment analysis techniques were applied with VADER to the automatically translated contents of the posts and comments. Although this analysis yielded sentiment scores, the results were inconclusive. The team members that were more closely involved with this approach conjecture that the automatic translation into English required the complement of human-assisted verification, due to the idiosyncrasies of Portuguese language. This task could not be carried out due to time constraints – and thus this report does not present any visualizations or an attempt at interpreting the results – but remains a goal for further research.
- Images
- Image grouping
The images retrieved from the posts were subjected to some basic sorting techniques with the software Image Sorter. Grouping images by color proved to be the most interesting for further analysis.
Images with red, blue and white, all found in IL’s posts, are the most common in the corpus, denoting not only a consistent use of this template in the party’s posts but also confirming their prevalence within posts with more interactions and more “other reactions”, which, we may remember, were the primary criteria for corpus selection.
Images with green hues appear only in the European elections data, and this hue is apparently used for “green” content – i.e., posts with the category “Animal and Environmental Rights”, which, as already mentioned above, is the dominant subcategory in PAN’s posts.
- Image features
The following heatmap visualisations show, according to Google Vision API’s “Safe Search” module, the probability of having, in the images belonging to the corpora, features that may classify them respectively as “adult oriented”, “spoof or parody” (image modified, often to become offensive), “medical”, “violent” or “obscene or provocative”. As before, individual analyses were made for the European Elections (Figure 16) and the Legislative Elections (Figure 17).
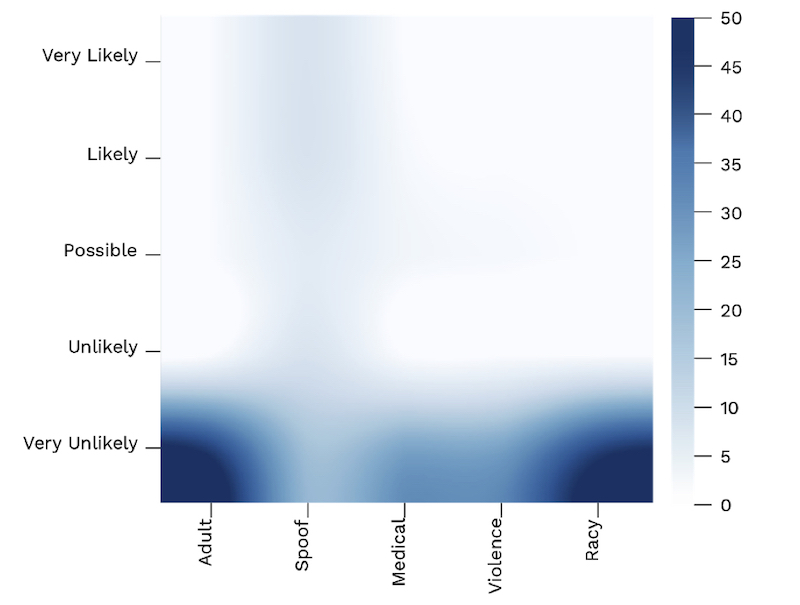
Figure 16. Heatmap for Safe Search features on images (European Elections).
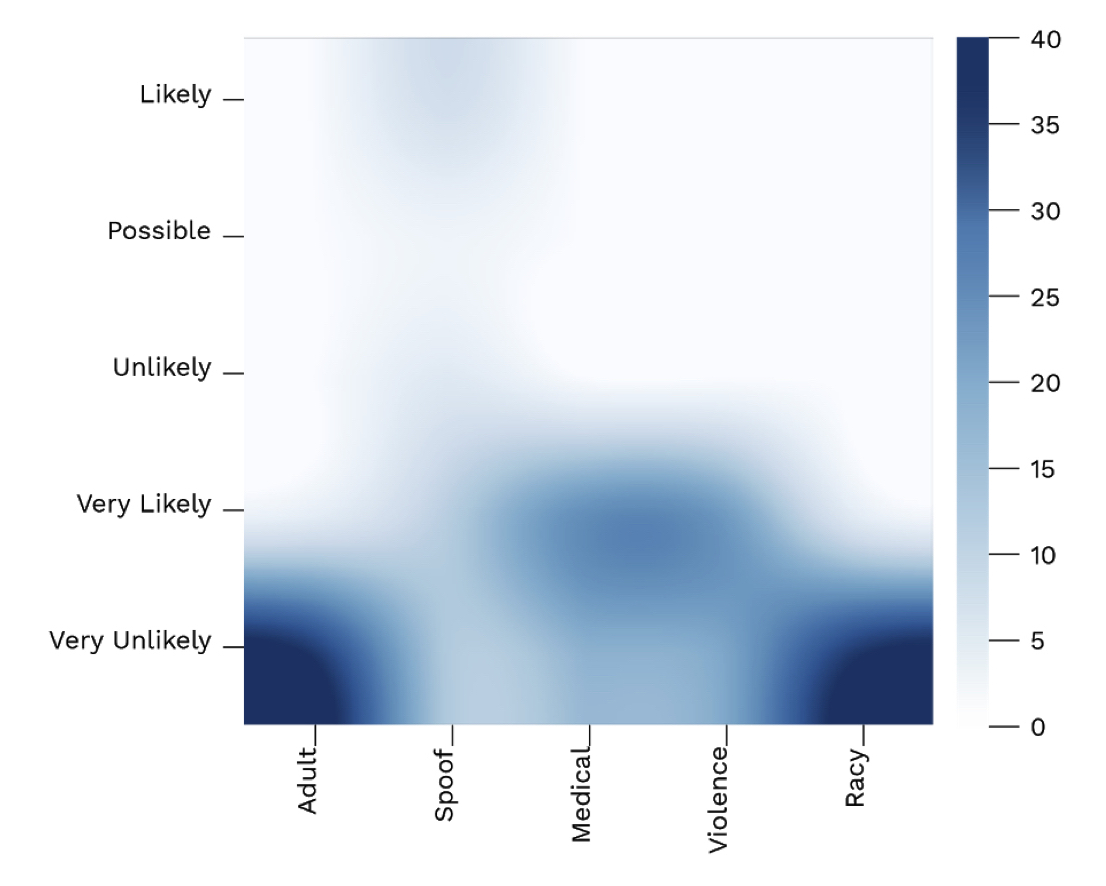
Figure 17. Heatmap for Safe Search features on images (Legislative Elections).
From what can be read in these visualisations, the overwhelming majority of the images was marked as “very unlikely” having any of the above mentioned features, though with some likelihood of spoofing for images both in the data sets from the European Elections (Figure 16) and from the Legislative Elections (Figure 17). In the case of those belonging to the Legislative elections set, the likelihood of having images with medical or violent content increases slightly, but still far from being unequivocal positives.
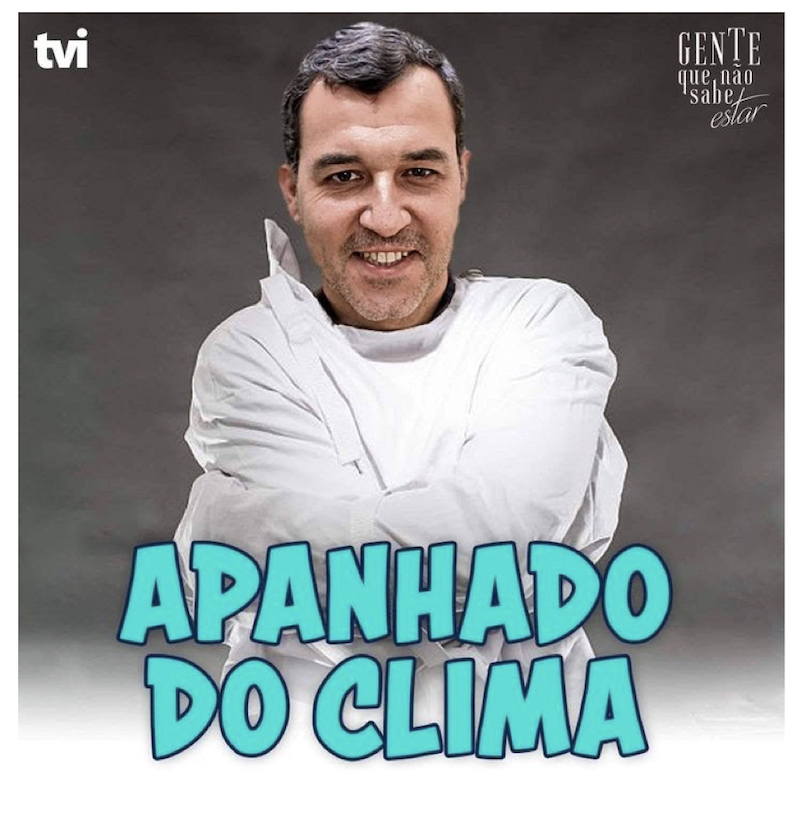
One image (Figure 18) that drew the attention of the team is indeed a spoof, a photoshopped image of PAN’s leader and main candidate André Silva in a post by this party. The analysis of both the image and the post content shows that it was intentional humour – self-deprecating humour, if the expression suits – as an announcement for a forthcoming interview in a TV program hosted by the comedian Ricardo Araújo Pereira.
Figure 18. Example of an image with “Spoof” features.
As mentioned in the Introduction, the answers to our Research Questions should also consider the mapping of the parties according to their foundation time and ideological position, as represented in Figure 19. Given that the selected corpora filters the posts from the two electoral periods according to the criteria of highest amount of interactions and highest amount of “other reactions”, this already shows that newer parties (with the exception of Free (L) were overrepresented in our data subsets, a clue that we followed across each specific analysis. In the remaining paragraphs, we will address RQ 1 and RQ 2 with this in mind.
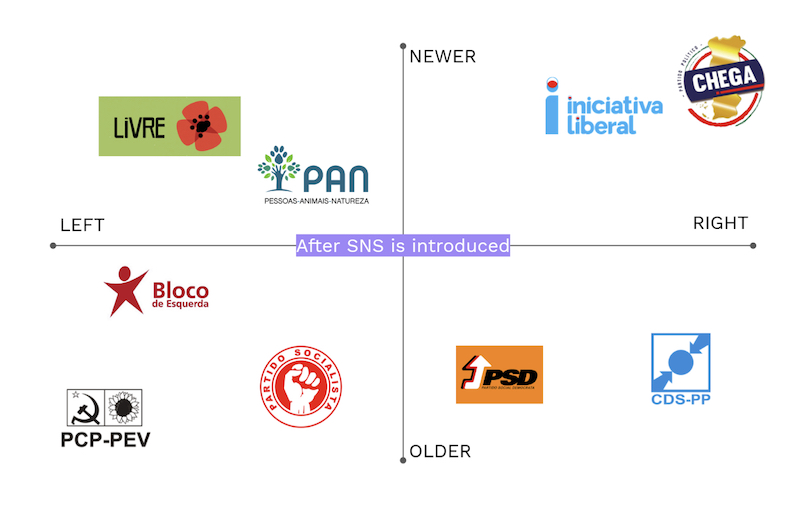
Figure 19. Mapping of political parties (political spectrum x foundation time).
RQ 1: How differently official parties try to engage with Facebook users in the two major 2019 elections periods in Portugal?
- Regardless of the party and its specific positioning in the map, and also both for European and Legislative Elections, posts are predominantly from the main categories “National Politics”, “Fundamental Rights”, and “Self-Promotion”. “European Politics” was, surprisingly, barely a topic in the posts with more “other reactions”.
- However, differences in the communication strategies become more manifest when considering the subcategories. IL favors ”Economy and Fiscality” (a subcategory of “National Politics”) and PAN “Animal and Environmental Rights” (a subcategory of “Fundamental Rights”), thus allowing to classify them as “single-issue parties”. And while left (and especially more left-wing) parties slightly favor broader concepts like “Democracy x Dictatorship” (subcategory of “Fundamental Rights”), right-wing parties, especially the newer ones (IL and CH), resort to themes that have a higher confrontational potential, such as “Corruption and political ethics” or “Political ideology and situationism”, if not outright “Confrontation with political opponents”. That agonistic approach seems to increase during the campaign periods.
- The analysis of the most frequent words in the posts shows a common agreement regarding “freedom” (notably in the Legislative Elections), but other concepts may be too spread out (both considering the posts and the parties) and thus with frequencies too low for other conclusions can be drawn.
- Emojis are rarely used as part of the parties’ communication strategies, with PAN being the exception (almost always using symbols that confirm their focus with “Animal and environmental rights”, although we did not attempt to correlate the emojis with the categories). However, two other newer parties (IL and CH) show an increase in emoji usage for the Legislative Elections, which took place later in the year.
- Using images is also a transversal strategy across all parties, with an over-representation of posts by IL, one of the newer right-wing parties. Though this may be due to a sample bias, this newer party is very consistent in their visual aesthetics, using their colors (white, red, and especially cyan blue) in almost all image posts.
- For other parties, there is more visual (or at least chromatic) diversity, but “risky” images – i.e., those that may be flagged as less appropriate in Google’s Vision API Safe Search detection algorithms – are for the most part avoided. Spoofing for humorous or parodical objectives, either to mock the opponents or as lighthearted forms of self-deprecation, was however found in a few images, even if Google Vision did not flag these with a high degree of certainty. Again, this particular approach to images tends to be more common with the newer parties.
RQ 2: What type of content receives the most attention and engagement from the users?
- If solely considered from the perspective of interactions as a whole, some of the items and interpretations above identified for RQ 1 also apply to RQ 2. I.e., posts with images attract more attention, and apparently this may be leveraged if the textual content of the post also picks “hot topics” within “National Politics”. While this claim is in need of further analysis, that may be one of the explanations for the success, engagement-wise but also in the vote turnout, of the newer parties. IL with posts about “Economy and fiscality”, CH with posts with a clear populist approach (“Corruption and political ethics”, “Confrontation with political opponents”, etc.).
- PAN’s success has some nuances if confronted with those other parties: on the one hand, they are positioned at the center-left rather than in the right of the spectrum; on the other they are the “oldest” and more established of the newer parties, with representation in the national parliament since 2015. The engagement with the audience seems to be achieved with their most common topic (“Animal and environmental rights”), and also by a more consistent usage of emojis. Conversely, they are also the party that receives more emojis in the comments, which may be due to a “mirror” effect: emojis in the posts may be read as an incentive to also use emojis in the comments.
- This engagement with image posts seems to be particularly significant when considering “other reactions” (Haha, Wow, Sad, Angry). I.e., there may be a stronger correlation – which however can only be confirmed through a more thorough analysis which could not be done in this data sprint context – between image posts and these more polarized reactions than in the cases of “Like” or “Love”. However, the prevalence of posts from IL may have introduced a bias in the analysis.
- Due to the mentioned drawbacks in sentiment analysis, explained by translation issues, no relevant fluctuations in the sentiments (in intensity or from positive to negative and vice-versa) could be detected. That seems, however, to be a very rich path for further analysis.
Bennett WL (2012) The personalization of politics: Political identity, social media, and changing patterns of participation.The annals of the American academy of political and social science 644(1): 20–39.
Effing R, Jos VH and Huibers T (2011) Social media and political participation: Are facebook, twitter and youtube democratizing our political systems? In: International conference on electronic participation. Springer, pp. 25–35.
Enli GS and Skogerbø E (2013) Personalized campaigns in party-centred politics: Twitter and facebook as arenas for political communication. Information, Communication & Society 16(5):757–774.
Heiss R, Schmuck D and Matthes J (2019) What drives interaction in political actors’ facebook posts? profile and content predictors of user engagement and political actors’ reactions. Information, Communication & Society 22(10): 1497–1513.
Hutto, C.J. & Gilbert, E.E. (2014). VADER: A Parsimonious Rule-based Model for Sentiment Analysis of Social Media Text. Eighth International Conference on Weblogs and Social Media (ICWSM-14). Ann Arbor, MI, June 2014.
Junger J & Keyling T (2019) Facepager. An application for automated data retrieval on the web. Source code and releases available at https://github.com/strohne/Facepager/.
Kalsnes B (2016) The social media paradox explained: Comparing Political parties’ facebook strategy versus practice.Social Media + Society 2(2): 2056305116644616.
Kapoor KK, Tamilmani K, Rana NP, Patil P, Dwivedi YK and Nerur S (2018) Advances in social media research: Past, present and future. Information Systems Frontiers 20(3): 531–558.
Larsson AO (2016) Online, all the time? a quantitative assessment of the permanent campaign on facebook. New Media & Society 18(2): 274–292.
Larsson AO and Kalsnes B (2014) ‘of course we are on facebook’: Use and non-use of social media among swedishand norwegian politicians. European Journal of Communication 29(6): 653–667.
Lilleker DG, Tenscher J andˇStetka V (2015) Towards hypermedia campaigning? perceptions of new media’s importance of campaigning by party strategists in comparative perspective. Information, Communication & Society 18(7): 747–765.
Macnamara J (2011) Pre and post-election 2010 online: What Happened to the conversation? Communication, Politics, Culture.
Magin M, Podschuweit N, Haßler J and Russmann U (2017). Campaigning in the fourth age of political communication.a multi-method study on the use of facebook by german and austrian parties in the 2013 national election campaigns. Information, Communication & Society 20(11): 1698–1719.
Serra-Silva S, Dias Carvalho D and Fazendeiro J (201) Party-citizen online challenges: Portuguese parties’ facebook usage and audience engagement. Changing Societies: Legacies and Challenges. Vol. 2. Citizenship in Crisis: 185–214.
Stieglitz S and Dang-Xuan L (2013) Emotions and information diffusion in social media–sentiment of microblogs and sharing behavior. Journal of Management Information Systems 29(4):217–248.
Stromer-Galley J (2003) Diversity of political conversation on the internet: Users’ perspectives. Journal of Computer-Mediated Communication 8(3): JCMC836.
Vergeer M and Hermans L (2013) Campaigning on twitter: Microblogging and online social networking as campaign tools in the 2010 general elections in the Netherlands. Journal of Computer-Mediated Communication 18(4): 399–419.
Appendix I: List of political parties
The list below shows the 10 political parties and one coalition, from left to right in the political spectrum, and their hyperlinked Facebook pages:
- PCP (Portuguese Communist Party)
- CDU (Unitary Democratic Coalition, between PCP and PEV)
- PEV (The Greens Ecologist Party)
- BE (Left Block)
- LIVRE (Free)
- PS (Socialist Party)
- PAN (People-Animals-Nature)
- PPD/PSD (Social Democratic Party)
- IL (Liberal Initiative)
- CDS-PP (Popular Party)
- CH (Enough)
Appendix II: List of categories
|
MAIN CATEGORY |
SUBCATEGORIES |
|
FUNDAMENTAL RIGHTS |
Animal and environment rights |
|
Democracy x Dictatorship |
|
|
Digital rights |
|
|
Equality and inclusion |
|
|
Human rights |
|
|
INTERNATIONAL POLITICS |
Europe |
|
Rest of the world |
|
|
MISCELLANEOUS |
Miscellaneous |
|
NATIONAL POLITICS |
Confrontation with political opponents |
|
Constitution |
|
|
Corruption and political ethics |
|
|
Culture |
|
|
Decentralization |
|
|
Economy and fiscality |
|
|
Education |
|
|
Elections |
|
|
Election results |
|
|
Health |
|
|
Natality |
|
|
Political ideology and situationism |
|
|
Public administration |
|
|
Public service television |
|
|
Security and justice |
|
|
Yellow jackets |
|
|
SELF-PROMOTION |
Candidates |
|
Events |
|
|
Funding |
|
|
Internal organizational affairs |
|
|
Militants |
|
|
Online presence |
|
|
Presence in the media |
|
|
The party in Europe |
|
|
SOCIOCULTURAL ISSUES |
Entrepreneurship |
|
The media |
|
|
Political correctness |
|
|
Poverty and social exclusion |
|
|
Precarity and labor |
|
|
Religion |