
Project: Cross-Platform Digital Networks
Subproject title: Climate Change: The networks of #climatechange hashtag engagement & “climate emergency” image circulation.
Team members (alphabetical order): Daniela Van Geenen, Germán Llorca-Abad, Giacomo Flaim, Lorena Cano-Orón, Herbert Natta, Janna Joceli Omena, Jason Chao, Serene Del Nero, Verónica Israel Turim,
Key Findings
Introduction
Research Questions
Query Design & Visual Protocol
Findings
Discussion
References
What we discover from #climatechange co-hashtag analysis:
The co-hashtag analysis of #ClimateChange on Twitter and Instagram highlights differences in usage and content across platforms. Hashtag engagement can either indicate helpful insights on the subject of study (here #climatechange) and indicate emerging global issues, even if these are not the main goal of the study. In our case study, and although not looking for it, #coronavirus was part of the most co-occurring hashtags on Twitter. On Twitter, the origin of the most widespread RTs was Australia, United Kingdom, United States and Canada. In the case of Instagram, the clusters appeared much more defined by the subject matter and we found that the use of the hashtag was more related to arts and design.
What we discover from “climate emergency” computer vision API based network:
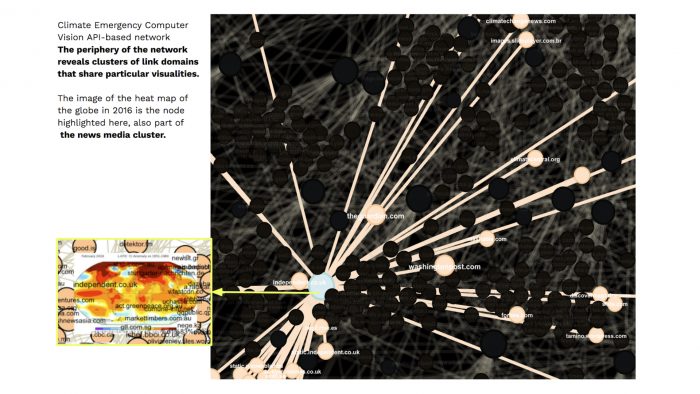
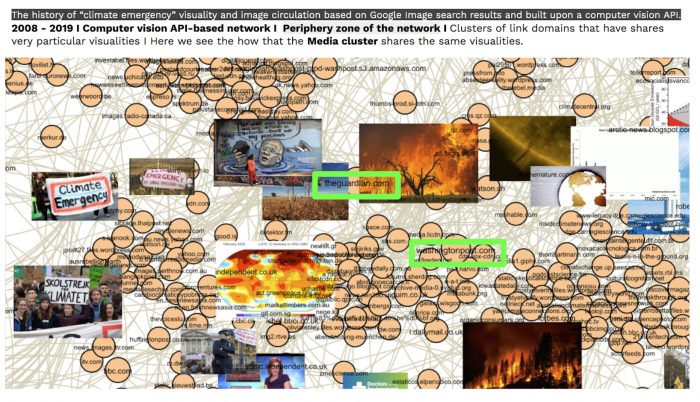
Blogs (wordpress and blogspot) and social media (Twitter, Facebook, Pinterest) have led the spread of images cross-platforms concerning climate emergency over the past ten years. The periphery zone of the network reveals clusters of link domains that share very particular visualities, such as the news media cluster. This latter, with washingtonpost.com and the guardian.com as the main actors, shows the climate emergency visuality shared by mainstream international media (e.g. forests or the globe on fire, the display of protests and graphics).
This study was conducted by an international group of researchers, English was the language used for the research and hashtag selection. We conducted an exploratory case study based on Climate Change hashtag engagement on Twitter and Instagram. On both platforms, our goal was to identify the main hashtags related with #climatechange (correlated hashtags as issues spaces) and to compare the cultures of appropriations of #climatechange and related tags on Twitter and Instagram. Adding to that, this study also proposes to explore the retweet networks and understand where are the most retweeted users from (actors). We furthermore, turned our attention to the visuality of Climate Change by repurposing Google Images Search engine over time. To this task, we focused on the imagery of “climate emergency” from 2008 to July 2019.
#climatechange I Twitter I Instagram
Which are the main hashtags related with #ClimateChange? Co-hashtag
How does the RT network look like and how are actors connected?
How is the relation between hashtags (crossplatform)?
“climate emergency” I Google Image Search
How can we read computer vision API-based networks built upon web detection properties?
Where has the visuality of “climate emergency” been circulated over the past 12 years? (link domains)
Who are the main actors responsible for “climate emergency” image circulation and what is the visuality related to them?
Query Design & Visual Protocol
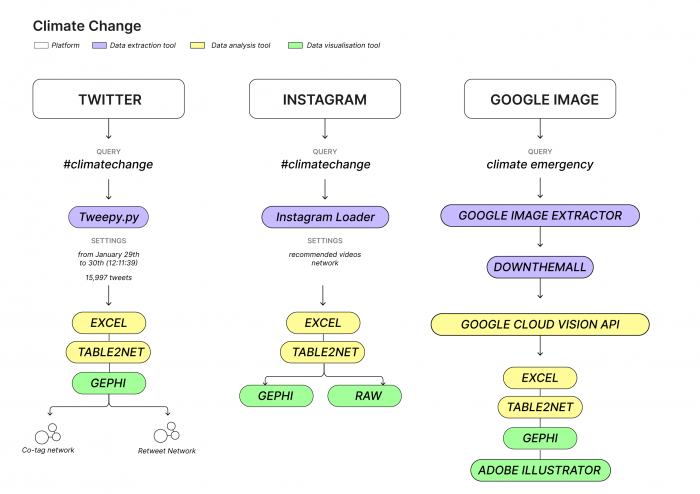
For practical reasons, and due to the strict time limits we have for this research, we decided to focus on two social media platforms – Twitter and Instagram, and a search engine – Google Image Search. For Twitter and Instagram, we chose #climatechange in order to find out the hashtags network around this very important topic. For Google Image Search, we worked with computer vision API based networks, but, rather than relying on the machine learning labelling capacity to automated visual content analysis (Ricci et al. 2017; Mintz et al. 2019), we opted for a still unexplored feature of Google Vision Cloud API in network studies: web detection which detects Web references to an image (e.g. web entities, visually similar images, pages with matching images). The network built for this study was thus based in the category full matching image; this feature provided from 1 to 50 different URLs to Web images that fully match the images in the request. In this study, the images ranked by Google Image Search when one searches for “climate emergency” (see also Reading Digital Networks). To explore the cross-platform digital networks, we adopted the visual network analysis approach (Venturini et. al. 2015; 2019), which focuses on the visual affordances of the network, such as node position, colour and size.
- #climatechange
Query: #climatechange
Data selection and extraction:
We have extracted data from January 29th to 30th (12:11:39) using Tweepy, a Python library through the Twitter API. The dataset contains 15,997 tweets.
Analysis software: Excel, Table2Net, Gephi and RawGraphs.
Based on this dataset we prepared two subsets to explore different types of networks (co-tag and retweet networks).
#climatechange co-hashtag network
With the help of Excel and Table2Net we built a network of #climatechange cooccurrences tags to be explored in Gephi. To do that, we prepared the database filtering the “hashtags” column erasing the [ ] symbols, as well as the ‘ simbol, as we detected they were generating duplicate results on the Gephi representation. We too decided to quit “climatechange” hashtag to see the relation among the other ones. Once we checked the nodes column, and the links column, in order to find out if there were problems, and we built in the database file Table2Net.
We uploaded the CSV file to Table2Net to create the .gexf file. The configuration chosen was:
- Type of network “Normal”
- Nodes “username” (one expression per cell) + attributes “hashtags”.
- Finally, we established “row column” as the column to define the link between the nodes. No additional settings were added.
#climatechange retweet network
For the network of #climatechange retweets (RTs), the main dataset was filtered focusing on retweets (in Excel, we used the following filter: [starts with] “RT @”). This led to a selection of 11,029 retweets (RTs), which amounts to 69 % of the total number of tweets. Based on this prominence of RTs in the dataset and to have a look at the users who (re)distributed the hashtag climatechange and other hashtags that appeared in the same tweets with this first hashtag, we decided to take a closer look on the users who were retweeted (and those who sent the retweets).
In Excel, we prepared the RT-network for exploration in Gephi: by relying on the column that informed about the users who sent the RTs (“username”) to build a column of “sources”. Moreover, we extracted the users who were retweeted from the text and used these usernames to build a “target” column, which, together with the “source” column figured as the “edges table” that was imported into Gephi.
Moreover, we imported more qualitative information on the nodes into Gephi such as the user descriptions and user locations that were available in the original Twitter dataset. In Gephi, the “degree” network statistics was calculated. Degree calculates the total number of connections a node has received (indegree or the incoming connections) and made (outdegree or the outcome connections). In our dataset, “indegree” has a particular importance, because it pointed to the number of times a given user (or a list of users) was retweeted. We exported this “nodes table” including statistics (quantitative information on nodes) and user descriptions and locations (qualitative information on these accounts) into a spreadsheet for further analysis, amongst others in RawGraphs (Mauri et al. 2017)
Query: #climatechange
Data selection and preparation:
Extract the data using Python through Instagram loader.
Analysis software: Excel, Table2Net, Gephi and RawGraphs.
We have selected the hashtag column to analyze the co-tag / co-occurrence
We created a net with Table2Net (normal, nodes = hashtags).
Gephi settings:
## General settings
Undirected graph
Edges: 1591
Nodes: 137
————————————————————————————————————————
## Filter settings
Degree Rage: 2-69
Nodes: 137 (1,97 %)
Edges: 1591 (100 %)
————————————————————————————————————————
## Layout settings
ForceAtlas2
Scaling: 70.0
Gravity: 0.05
Edge Weight Influence: 1.0
Prevent overlap: true
> We filtered the network taking those nodes that have more than 2 connections.
> We ran the community detection algorithm (modularity), which detected 20 communities.
> In Gephi attributes, we used modularity as an attribute to colour the nodes and selected the biggest community.
> The biggest cluster´s main central nodes are: artist, art and design.
> The second cluster´s (in terms of amount of nodes) main central nodes are: vegan, savetheplanet and greenpeace.
> We applied prevent overlap to help the interpretation of the network.
> In order to see the biggest nodes we added a degree attribute filter.
After this step-by-step, we:
- Download the .csv file and open it in Excel.
- Clean data: eliminate blank cells, hashtag symbols and we eliminated the repost hashtag as it is one of the most used and is unrelated to what we are intending to investigate. Repost means something that has been posted before.
- We decided to remove #climatechange node from the network in order to better visualise the related clusters to our main topic of study.
- “Climate Emergency”
Google Image Search and Vision API
Query: “climate emergency”
Extraction software: Google Image Extractor and DownThemAll.
Analysis software: Google Cloud Vision API(web detection, full matching images), Excel, Table2Net, Gephi and Adobe Illustrator.
Previous work was done before the SMART Data Sprint week (see The History of Climate Change through Google search results and the expanded exploratory work in Reading Digital Networks). The previous work is summarised as it follows:
> The top 100 image URLs per year (2008-2019) ranked by Google Image Search was collected with the help of Google Image Extractor.
> In Google Image Search, the time filter was activated, query “climate emergency” year by year (from 2008-2019).
> Activate Google Image Extractor, copy and paste the results provided by the plug-in in a spreadsheet.
> Use DownThemAll to download the image URLs and build the spreadsheet with two columns (year and img_url).
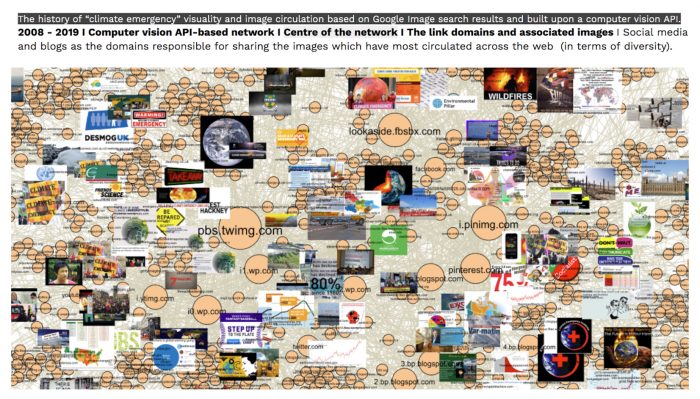
During the SMART Data Sprint, and thanks to the coding skills of Jason Chao, we took advantage of Google Vision API to verify the sites of “climate emergency” image circulation. We opted for the maximum capacity offered by this computer vision API, requiring the Cloud service to return from 1 to 50 different URLs in which the “climate emergence” images suggested by Google have circulated. To do that, we opted for the category full matching image; a feature that provides URLs that fully match the images in the request. The results present an inventive and pioneer network of the history of “climate emergency” visuality and image circulation based on Google Image search results and built upon a computer vision API (see here a similar network but for the study of bot engagement image circulation on social media).
#climatechange on Twitter & Instagram
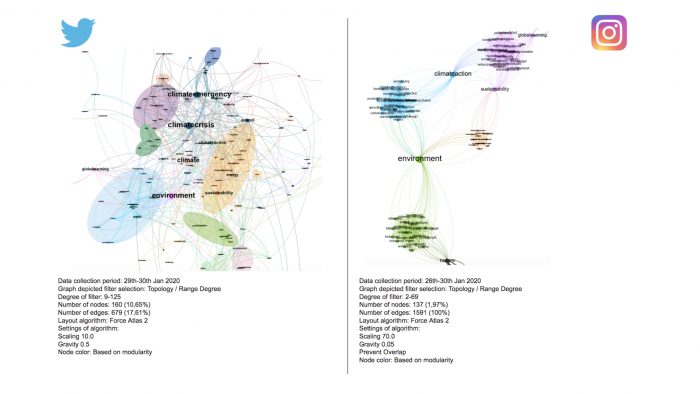
The results exposed the a strong correlation of #ClimateEmergency, #Climate Crisis, #Climate and #Environment in relation to #climatechange. We’ve found out, as a first glance, that there are some other important nodes related to all of them: #Sustainability, #ClimateAction, and #GlobalWarming. Once the main hashtags have been identified, the relations show some areas in which “conversations” are being held. For instance, the discussion on Energy, Political Initiatives, Climate Change Activism, Farming Related Issues, and Propeace Movements. These conversations appear as the main clusters in the hashtag correlated network of #climatechange (see the highlighted areas in the visualizations below). The Instagram network clusters are more defined and separated by specific topics.
On the analysis of the authors’ profiles, we couldn’t perform all the research. However, we discovered that the actors for the climate change deniers, are located outside the main discussion. Some of the information we’ve found out is clearly linked to news related to fires in Australia, Greta Thunberg’s campaign, or the impeachment process in the USA, or plastics pollution.
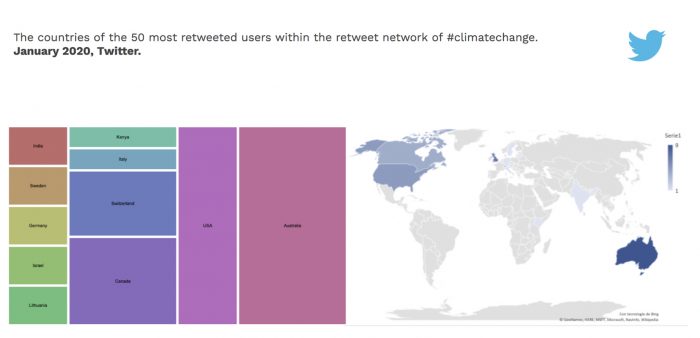
The treemap displays the countries of the 50 most retweeted users within the retweet network of #climatechange, while the heatmap shows the hierarchy based on global occurrence. The countries from where the most retweeted users are from are: Australia, UK, USA and Canada.
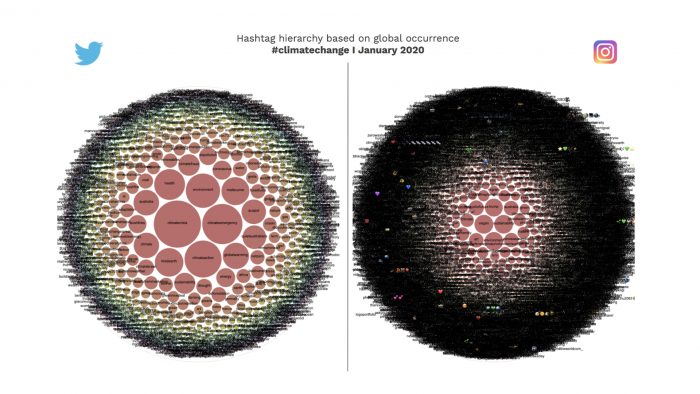
While on Twitter we see a low number of hashtags related to climate change, on Instagram there were more co-occurrences of tags but used less frequently if compared to Twitter. This may point to the culture of hashtag use on Instagram which allows more than 30 tags in a publication. An unexpected correlation pops up in the circle packing data viz: the relation between #coronavirus and #climatechange. At the time of the data collection, the disease was not yet considered a threat to the global community nor officially taken as a pandemia.
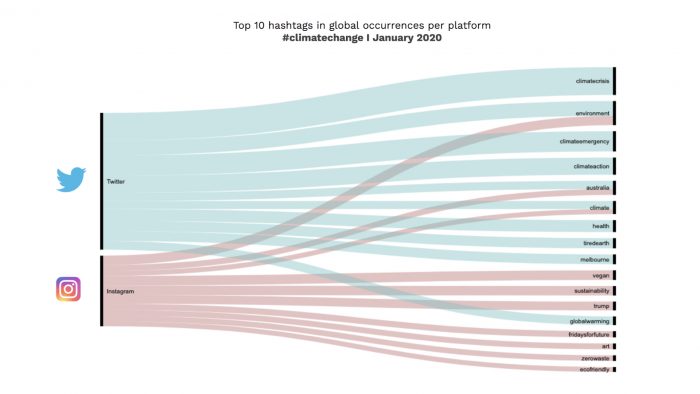
From the top 10 most used hashtags (image below), the four shared tags (#environment, #Australia, #climate, #globalwarming) emphasise not only the general climate change concerns but indicate the peak of the Australia Fires in January 2020. When looking at platform specific top used tags, the conversations pinpoint very particular issues. On one side (Twitter), the warning and call for action with #climatecrises, #climateemergency and #climateaction. On the other side (Instagram), for instance, politics (#trump), way of living (#vegan, #ecofriendly) and movements (#fridaysforfuture) take part in the debate.
To conclude this section, in the sphere of Twitter, users who deny climate change do not have a noticeable impact. From the analysis we suspect that there is a correlation between the discussion that originates in Twitter and the content that the media publishes about climate change. Additionally, on Twitter, although we use less variety of hashtags, these were used much more intensively (more occurrences) in this platform, while in the case of Instagram it’s the opposite: we use a lot more hashtags but, maybe precisely because of that, they are used less often (less occurrences).
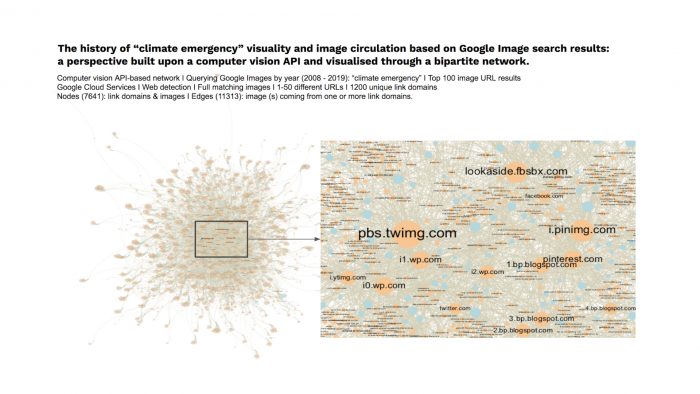
Computer vision API-based network: The history of “climate emergency” visuality and image circulation based on Google Image search results and advanced by the web detection module (full matching images).
The findings shared in this part have as referential bases the technique of interpreting networks through their visual affordances (Venturini et. al 2015) combined with a very particular framework for reading cross-platform digital networks (Omena & Amaral, 2019; Omena 2019) which pays particular attention to the narrative affordances of the layout algorithm ForceAtlas2 (Jacomy et al. 2014). The following analysis refers to a computer vision API-based network that puts together the history of “climate emergency” visuality and image circulation based on Google Image search results and advanced by the web detection module (full matching images) of Google Vision API.
In the network below, the nodes are both link domains and images , while the connections indicate whether a given image (blue nodes) appears in one or more link domains (orange nodes). To understand the spatialisation of this type of computer vision-based network, see the visualizations below in a black background.
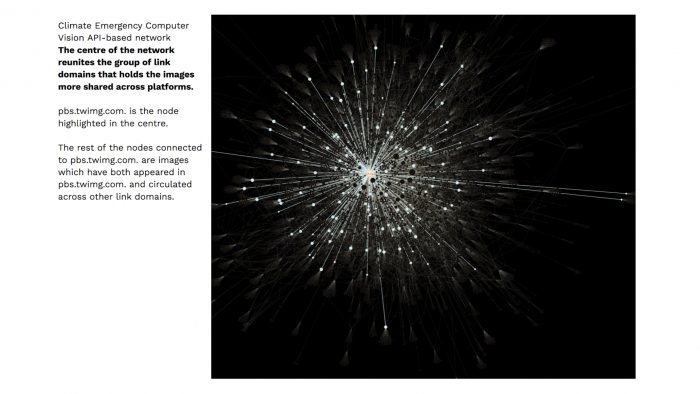
Through looking at the centre of the network, we found that blogs (wordpress and blogspot) and social media (Twitter, Facebook, Pinterest) are the dominant domains in holding the climate emergency images that have most circulated cross-platforms over the past ten years. The visuality found in the centre of the network is very diverse but also typically representative of climate emergency; such as images depicting protests, graphics, fires or the picture of the globe and posters (some with the phrases “Be prepared not scared” and “Don´t wait. Communicate. Make your emergency plan today.”).
The periphery zone of the network reveals clusters of link domains that share particular visualities, such as the news media cluster; composed by both mainstream international and local news media. With washingtonpost.com and the guardian.com as the main domains (in size), the news media cluster brings a similar visuality if we compare it to the centre of the network, such as the presence of protests and graphics. However, here, we also see the display of forest fires, the figure of a television journalist, the focus on a policeman watching protesters and a mural displaying the Australian prime minister advertising a rally by students across the world to protest against climate change . Adding to that, the images of the protests focus on the message and not exactly in the crowd.
The co-hashtag analysis of #ClimateChange on Twitter and Instagram demonstrated the differences in forms of appropriation and content across platforms.
The results provided by the Climate Emergency case study had two main limitations. First, the content of the network required to be further explored, due to time constraints and volume of work we were unable to finish the analysis. Second point relates to the time perspective that was not contemplated in our analysis. Besides that, the vision API-based network presented insightful findings about climate emergency, and it furthermore introduced an inventive technique to study image circulation with basis on the affordances of a computer vision and the repurpose of Google Image Search results. In this type of network, two relational perspectives should be taken into account: i) a vision of the actors (link domains) by identifying the link domains responsible for sharing the images which have most circulated across other domains (in terms of diversity) – in the centre of the network; and, ii) a vision of the images by seeing when one or more images are shared by a particular cluster of link domains.
Jacomy, M., Venturini, T., Heymann, S., & Bastian, M. (2014). ForceAtlas2, a Continuous Graph Layout Algorithm for Handy Network Visualization Designed for the Gephi Software. PloS One (9)6, e98679.doi:https://doi.org/10.1371/journal.pone.0098679
Mauri, M., Elli, T., Caviglia, G., Uboldi, G., & Azzi, M. (2017). RAWGraphs: A Visualisation Platform to Create Open Outputs. In Proceedings of the 12th Biannual Conference on Italian SIGCHI Chapter (p. 28:1–28:5). New York, NY, USA: ACM. https://doi.org/10.1145/3125571.3125585
Mintz, A., Silva, T., Gobbo, B., Pilipets, E., Azhar, H., Takamitsu, H.,… Oliveira, T. (2019). Interrogating Vision APIs. Lisbon. Retrieved from https://metodosdigitais.fcsh.unl.pt/smart-2019/project-reports/interrogating-vision-apis/
Omena, J. J., & Granado, A. (2020). Call into the platform!. Revista ICONO14 Revista Científica De Comunicación Y Tecnologías Emergentes, 18(1), 89-122. https://doi.org/10.7195/ri14.v18i1.1436
Omena, J.J. (2019). Reading Digital Networks: Climate Emergency, Bolsonaro & Bot Image Circulation by Vision API. The social platforms. Retrieved from https://thesocialplatforms.wordpress.com/2019/12/07/reading-digital-networks/
Omena, J.J., & Amaral, I. (2019). Sistema de leitura de redes digitais multiplataforma. In J. J. Omena (Ed.), Métodos Digitais: Teoria-Prática-Crítica. Lisboa: ICNOVA.
Venturini, T., Jacomy, M., & Pereira, D. (2015). Visual Network Analysis. SciencesPo Media Lab working paper. Retrieved from https://www.researchgate.net/publication/278030230_Visual_Network_Analysis
Ricci, D., Colombo, G., Meunier, A., & Brilli, A. (2017). Designing Digital Methods to monitor and inform Urban Policy. Retrieved from https://hal.archives-ouvertes.fr/hal-01903809